Open Access
Fig. 11
Download original image
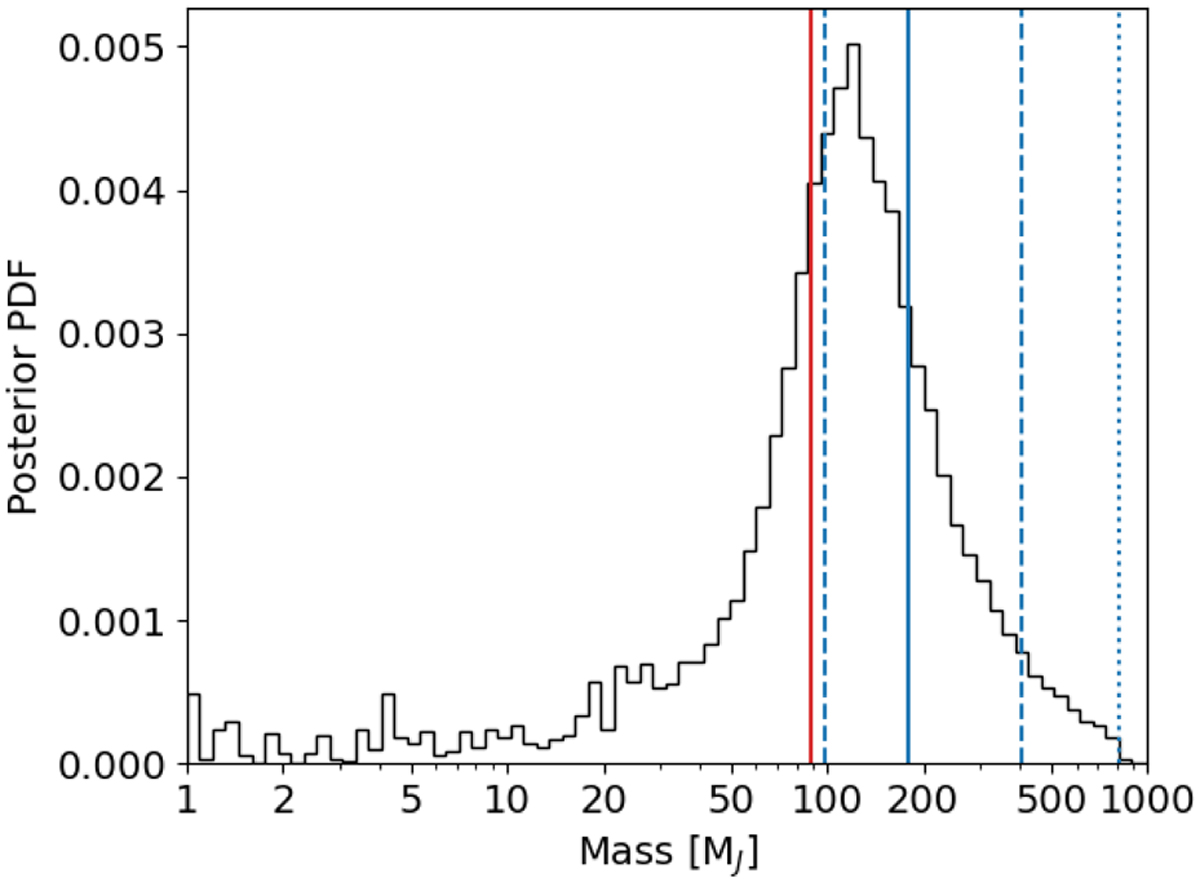
Illustration of HD 88986 outer companion analysis using Gaia DR3 analysis showing the companion mass posterior distribution running gaston. The dotted line shows the 3σ upper-limit, the dashed lines show the 1σ confidence interval, the solid blue line is the median mass, and the solid red line shows the RV m sin i.
Current usage metrics show cumulative count of Article Views (full-text article views including HTML views, PDF and ePub downloads, according to the available data) and Abstracts Views on Vision4Press platform.
Data correspond to usage on the plateform after 2015. The current usage metrics is available 48-96 hours after online publication and is updated daily on week days.
Initial download of the metrics may take a while.