Fig. 13
Download original image
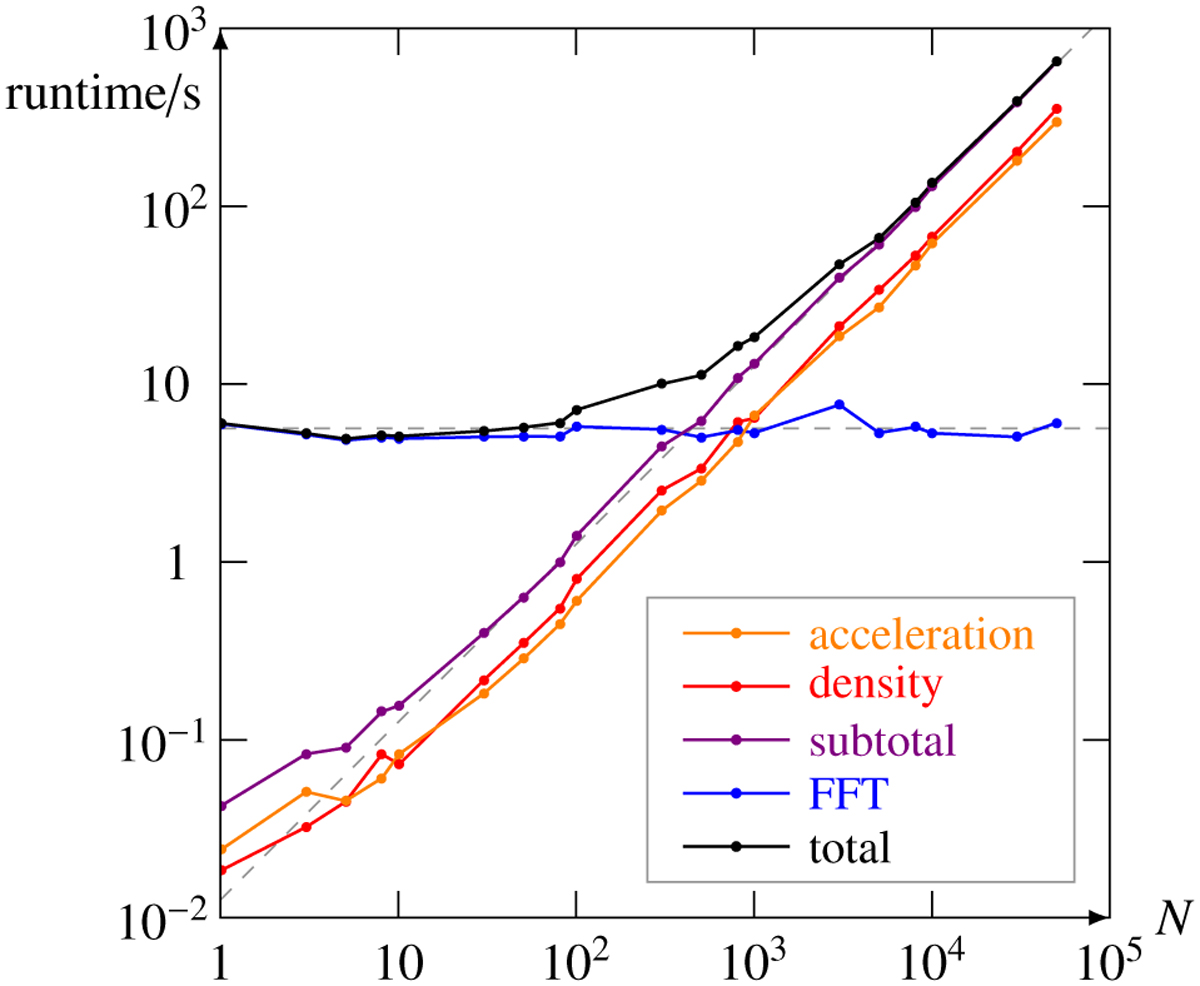
Runtime vs. particle count N for a 1283 grid with the Python code on an Intel Core i7-9750H. The time spend on the FFTs (blue) is roughly constant, and the time for the evaluation of the particle accelerations and/or densities grows linear with N (orange, red, and purple). The total runtime shows a crossover around 103 particles (black). The dashed lines are guides with slopes of zero and one.
Current usage metrics show cumulative count of Article Views (full-text article views including HTML views, PDF and ePub downloads, according to the available data) and Abstracts Views on Vision4Press platform.
Data correspond to usage on the plateform after 2015. The current usage metrics is available 48-96 hours after online publication and is updated daily on week days.
Initial download of the metrics may take a while.