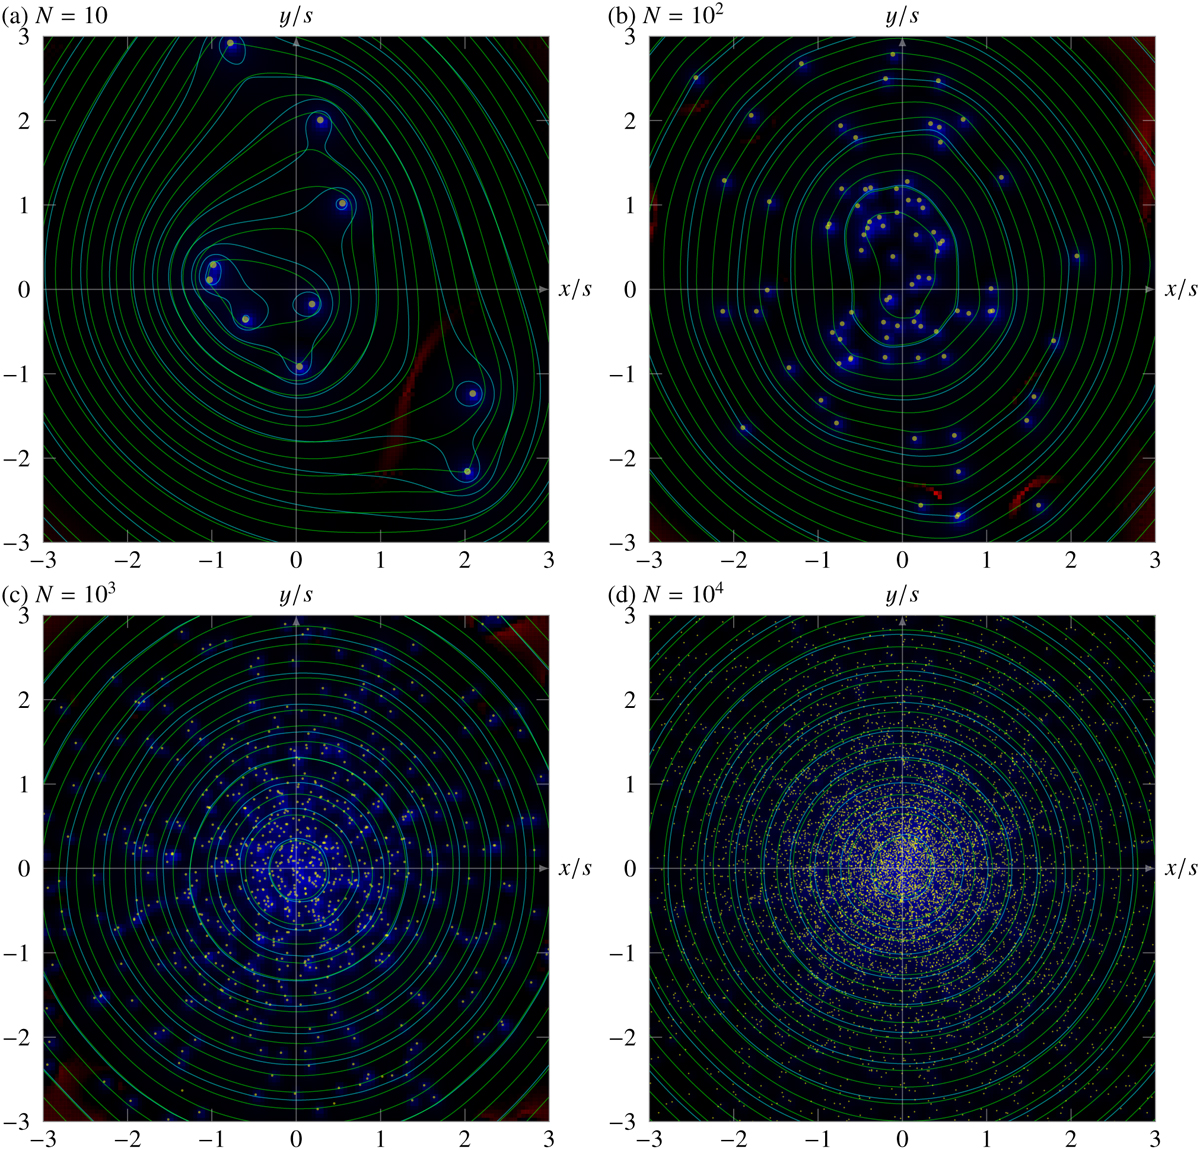
Fig. 11
Download original image
Surface-mass densities σ(x,y) and deflection potentials ψ(x,y) for a globular cluster from the central 128 × 128 part of a simulated cube of 2563 pixels. The yellow dots are the stars that define the actual density. The resulting apparent dark matter surface density is plotted in blue according to Eq. (11). Negative value are shown in red (Milgrom 1986). They are found for N ≤ 102. The equipotential curves of the deflection potential for Newtonian and Milgromian gravity are plotted in green and cyan. Although the densities are far from circularly symmetric, the deflection potential is nearly circular for N ≥ 103. This indicates that the retrieval of a clumpy mass distribution from weak lensing may be problematic for large N.
Current usage metrics show cumulative count of Article Views (full-text article views including HTML views, PDF and ePub downloads, according to the available data) and Abstracts Views on Vision4Press platform.
Data correspond to usage on the plateform after 2015. The current usage metrics is available 48-96 hours after online publication and is updated daily on week days.
Initial download of the metrics may take a while.