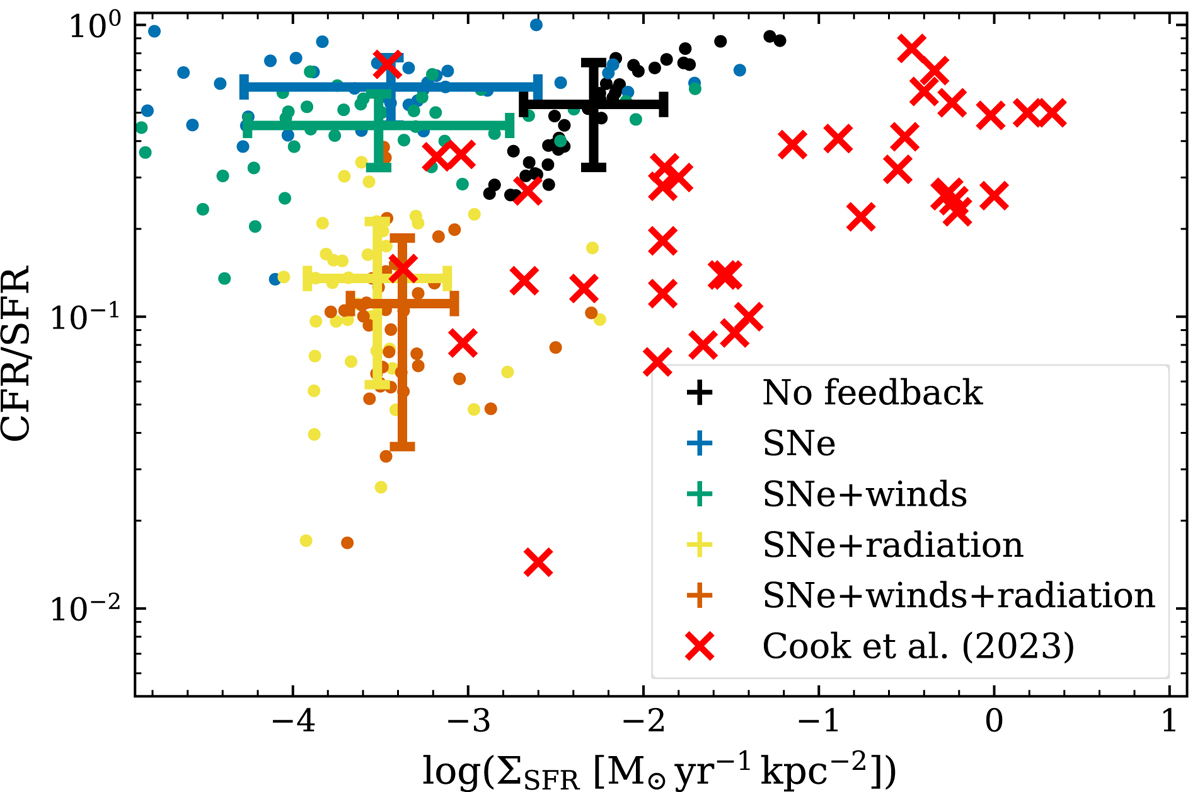
Fig. 8.
Download original image
Cluster formation efficiency as a function of star formation rate surface density. Colored points show individual outputs, while the colored error bars show the standard deviation around the mean of all points for a given simulation. Red crosses show estimates from observed galaxies considering young (1–10 Myr old) star clusters. Observed data shown are compiled by Cook et al. (2023) and include estimates from Goddard et al. (2010), Adamo et al. (2011, 2015, 2020a), Annibali et al. (2011), Pasquali et al. (2011), Cook et al. (2012), Lim & Lee (2015), Hollyhead et al. (2016), Chandar et al. (2017), Messa et al. (2018).
Current usage metrics show cumulative count of Article Views (full-text article views including HTML views, PDF and ePub downloads, according to the available data) and Abstracts Views on Vision4Press platform.
Data correspond to usage on the plateform after 2015. The current usage metrics is available 48-96 hours after online publication and is updated daily on week days.
Initial download of the metrics may take a while.