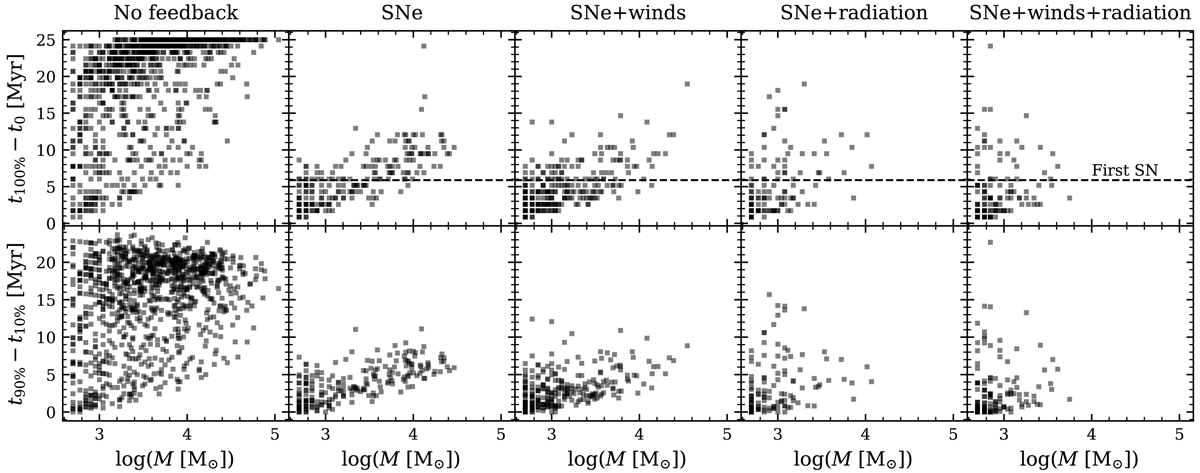
Fig. 7.
Download original image
Formation time of individual clusters as a function of their mass for each simulation. The top row shows the time between when the first star was born t0 and when the last star formed t100%, while the bottom row shows the time between when 10 and 90% of the total cluster mass has assembled. The horizontal dashed line denotes the main sequence lifetime of a 30 M⊙ star, which is the earliest time a star can deposit energy and momentum in a SN in our simulations.
Current usage metrics show cumulative count of Article Views (full-text article views including HTML views, PDF and ePub downloads, according to the available data) and Abstracts Views on Vision4Press platform.
Data correspond to usage on the plateform after 2015. The current usage metrics is available 48-96 hours after online publication and is updated daily on week days.
Initial download of the metrics may take a while.