Open Access
Fig. 5.
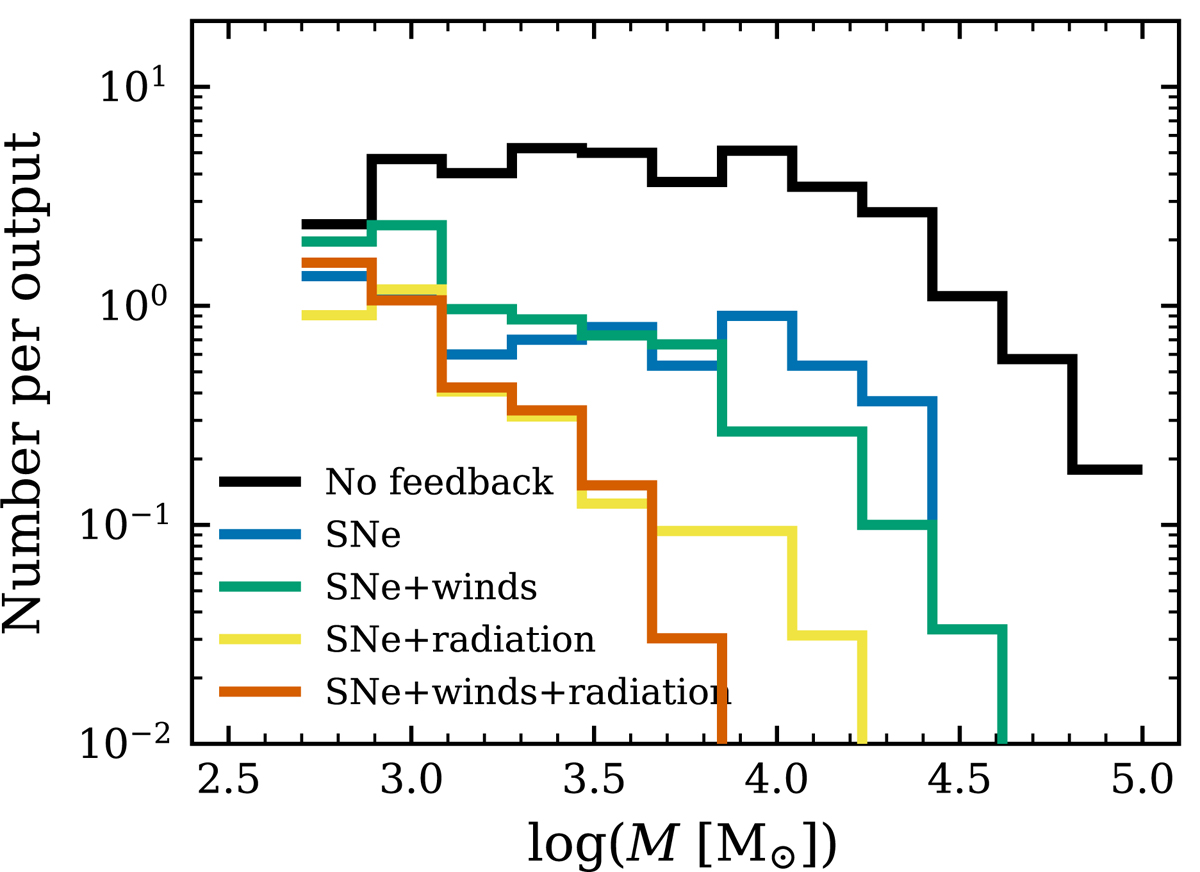
Download original image
Histogram showing the cluster mass function, normalized such that the y-axis gives the number of clusters expected when looking at a random simulation snapshot. Notably, all simulations have roughly the same number of low-mass clusters. This figure is identical to Fig. 4 except each line is normalized differently.
Current usage metrics show cumulative count of Article Views (full-text article views including HTML views, PDF and ePub downloads, according to the available data) and Abstracts Views on Vision4Press platform.
Data correspond to usage on the plateform after 2015. The current usage metrics is available 48-96 hours after online publication and is updated daily on week days.
Initial download of the metrics may take a while.