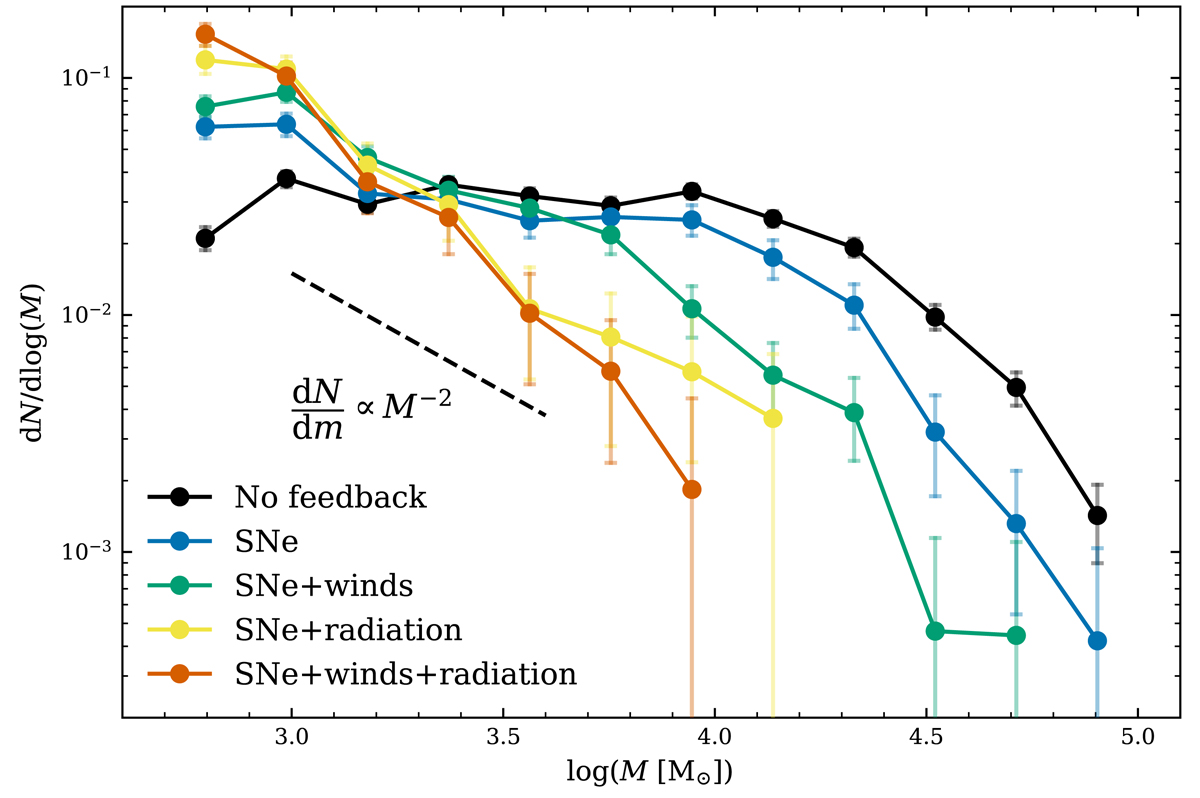
Fig. 4.
Download original image
Cluster initial mass function, normalized to the total number of clusters (defined as objects with ages < 25 Myr) found in each simulation after 300 Myr. The error bars indicate the 16th and 84th percentiles computed using bootstrapping. The dashed line shows the slope of scale-free formation models, often associated with the initial cluster mass function (see text for details).
Current usage metrics show cumulative count of Article Views (full-text article views including HTML views, PDF and ePub downloads, according to the available data) and Abstracts Views on Vision4Press platform.
Data correspond to usage on the plateform after 2015. The current usage metrics is available 48-96 hours after online publication and is updated daily on week days.
Initial download of the metrics may take a while.