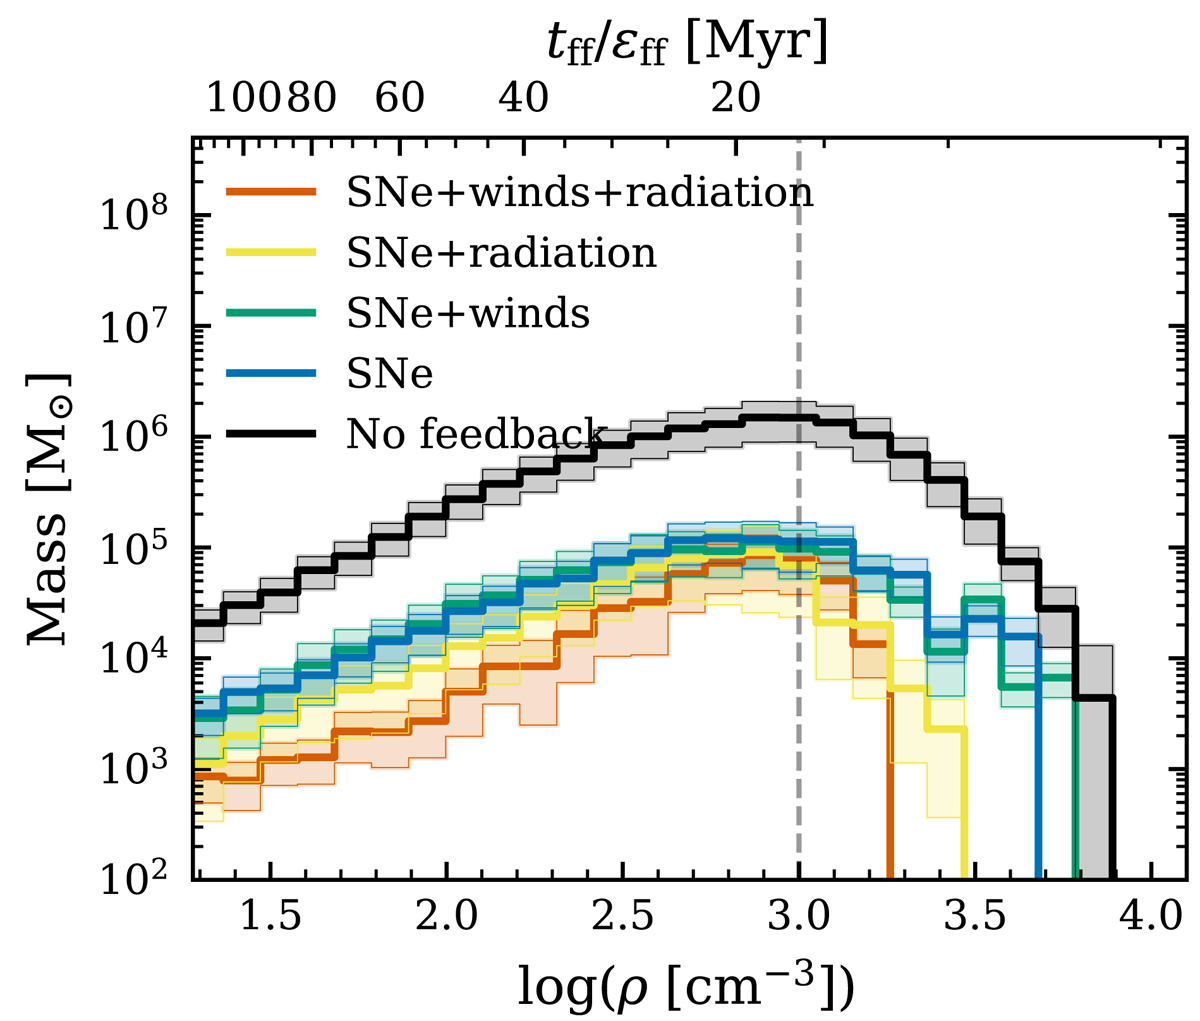
Fig. 3.
Download original image
Average mass distribution of gas densities inside clusters. The distribution is the mean of the mass-weighted histograms of gas densities inside clusters. The inside of a cluster is the spherical region enclosing all cluster members. The shaded region indicates the standard deviation around the mean value. The dashed vertical line indicates the density threshold we use for star formation. The top horizontal axis shows the ratio between the free-fall time and ϵff = 0.1 (see Sect. 2.2 for more details).
Current usage metrics show cumulative count of Article Views (full-text article views including HTML views, PDF and ePub downloads, according to the available data) and Abstracts Views on Vision4Press platform.
Data correspond to usage on the plateform after 2015. The current usage metrics is available 48-96 hours after online publication and is updated daily on week days.
Initial download of the metrics may take a while.