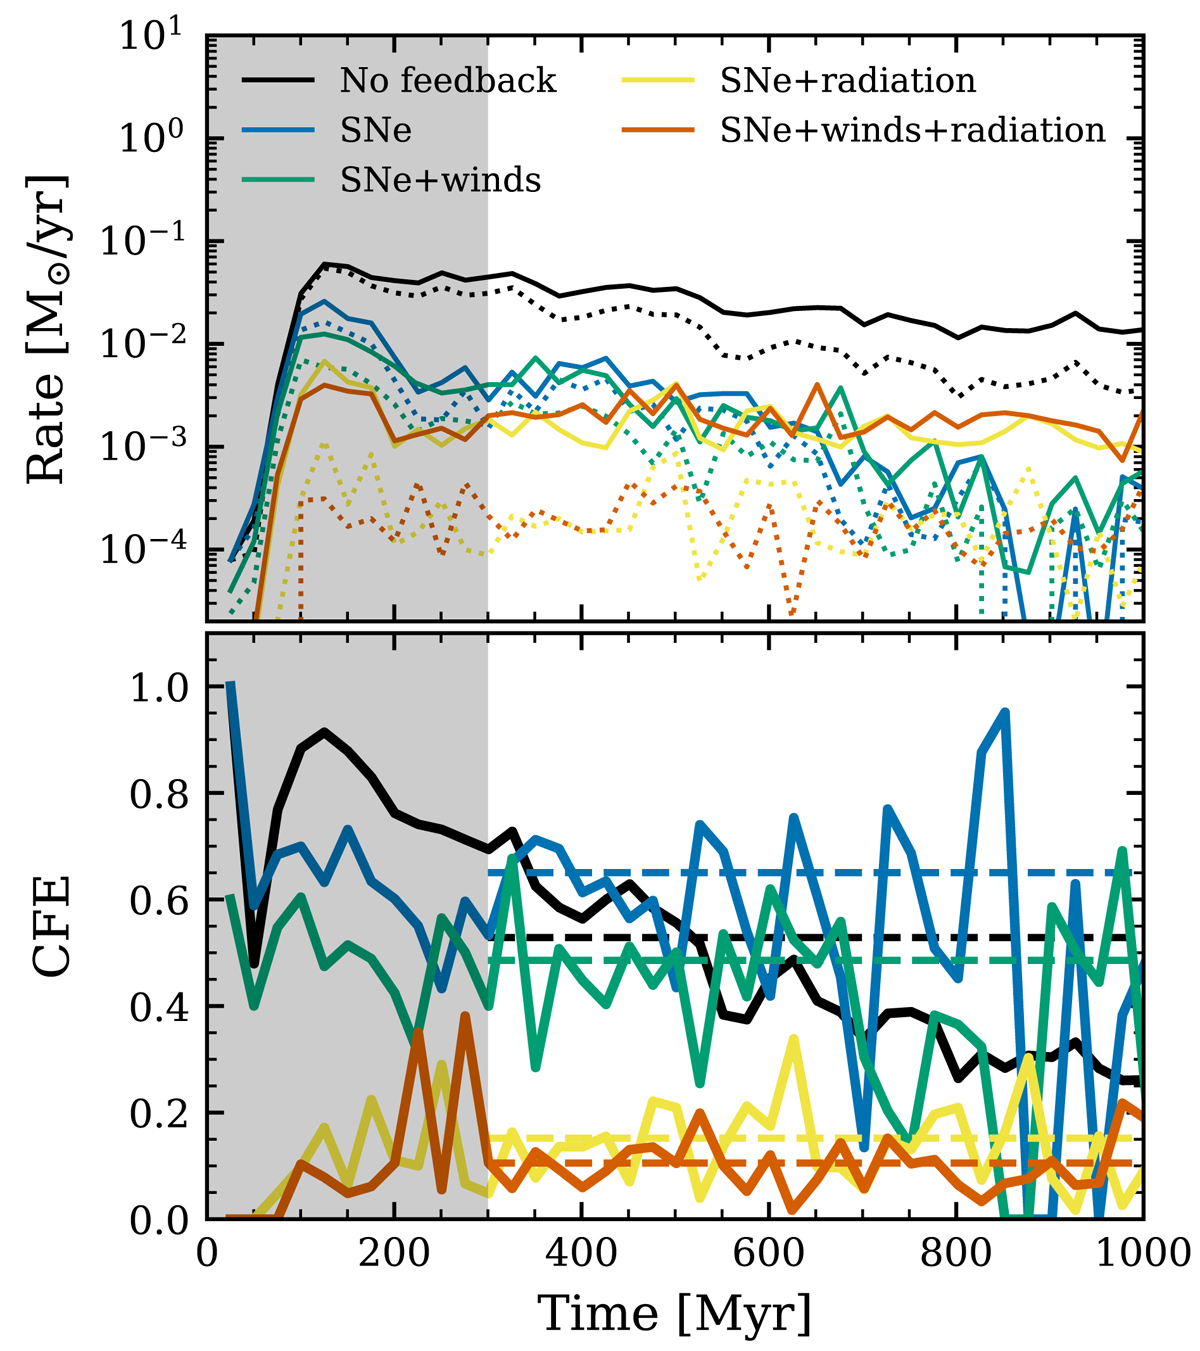
Fig. 2.
Download original image
Rate and fraction of stars formed in clusters. Top: SFR (filled line) and CFR (dotted line) as a function of time for all simulations. Both these quantities are measured on the same timescale (25 Myr). Bottom: the CFE as a function of time for all simulations. Dashed horizontal lines indicate the fractions of cluster mass to total stellar mass formed after 300 Myr (outside gray shaded region).
Current usage metrics show cumulative count of Article Views (full-text article views including HTML views, PDF and ePub downloads, according to the available data) and Abstracts Views on Vision4Press platform.
Data correspond to usage on the plateform after 2015. The current usage metrics is available 48-96 hours after online publication and is updated daily on week days.
Initial download of the metrics may take a while.