Open Access
Fig. 1.
Download original image
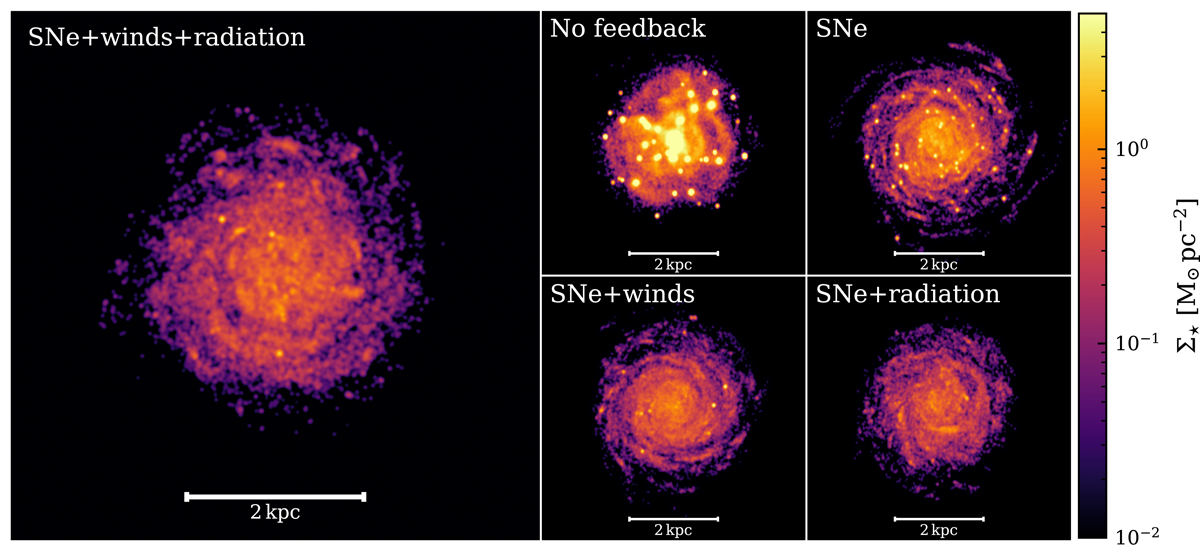
Face on view of the stellar surface density of all simulations. Each panel shows the last snapshot of the simulation (t = 1 Gyr). There is a notable increase in the number of visible star clusters in simulations with less feedback, compare, e.g., SNe and SNe+wind+radiation.
Current usage metrics show cumulative count of Article Views (full-text article views including HTML views, PDF and ePub downloads, according to the available data) and Abstracts Views on Vision4Press platform.
Data correspond to usage on the plateform after 2015. The current usage metrics is available 48-96 hours after online publication and is updated daily on week days.
Initial download of the metrics may take a while.