Fig. 6
Download original image
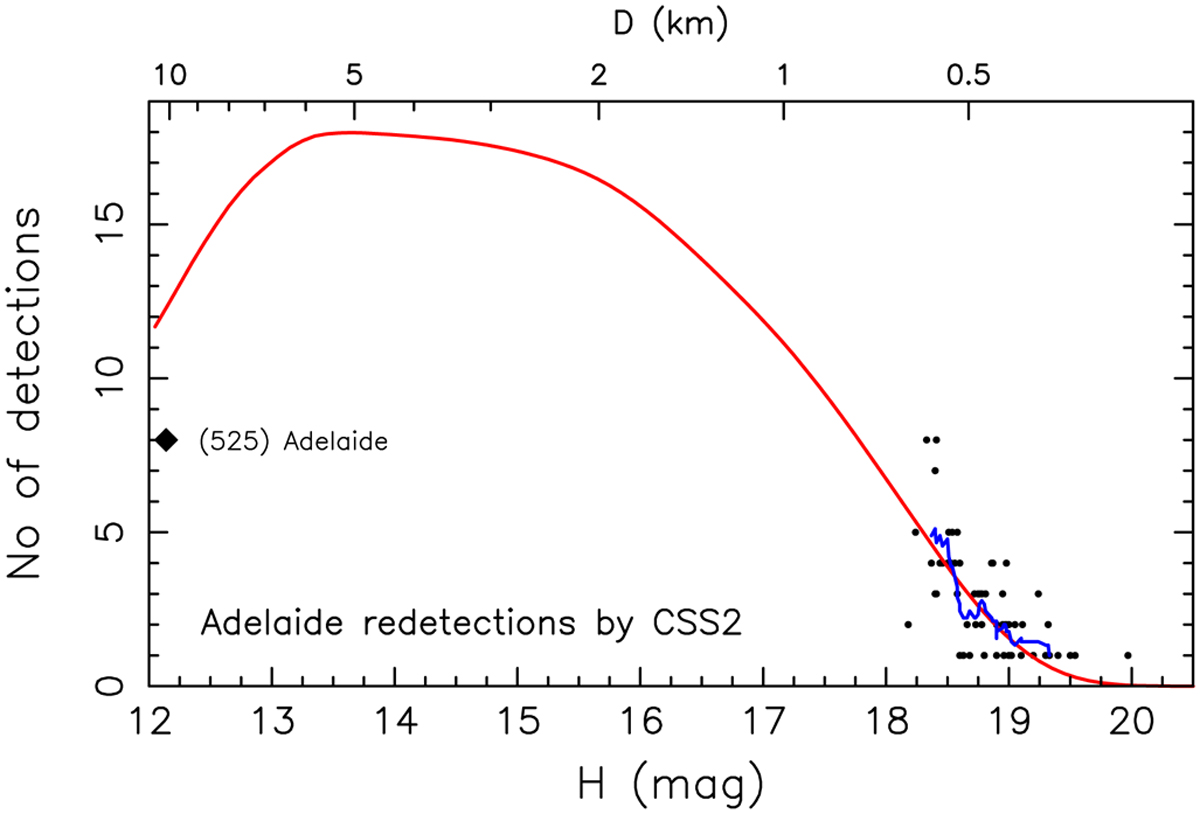
Number of detections of the identified Adelaide family members during the phase 2 CSS operations: the largest body (525) Adelaide shown by a diamond symbol and highlighted using a label, other 62 smaller members shown by black symbols. The red line is the theoretical prediction based on a large synthetic Adelaide population computed together with the detection probability p(H) from Fig. 5. The blue curve is a mean number of detections for the observed Adelaide members computed on a running window of 9 consecutive data-points.
Current usage metrics show cumulative count of Article Views (full-text article views including HTML views, PDF and ePub downloads, according to the available data) and Abstracts Views on Vision4Press platform.
Data correspond to usage on the plateform after 2015. The current usage metrics is available 48-96 hours after online publication and is updated daily on week days.
Initial download of the metrics may take a while.