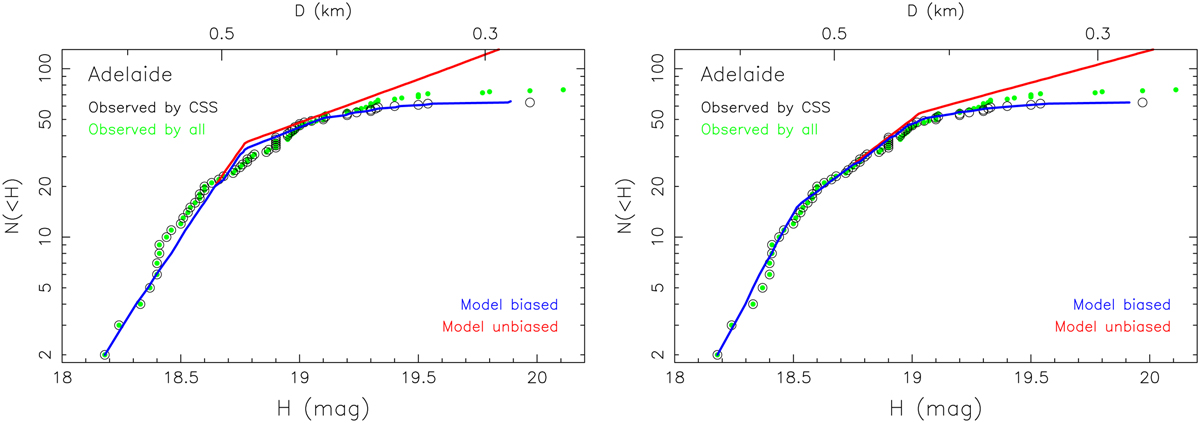
Fig. 19
Download original image
Best-fit solution of the complete Adelaide population to the magnitude limit H = 20 and its comparison to the observed population. Left panel: the broken power-law model ℳ2 with three adjustable parameters (Hbreak, γ1, γ2). The best-fit values (red star in Fig. 20) are: Hbreak = 18.78, γ1 = 2.08, and γ2 = 0.47, and the corresponding ![]() . Right panel: the broken power-law model ℳ3 with five adjustable parameters (Hbreak,1, Hbreak,2, γ1, γ2, γ3). The best-fit values are: Hbreak,1 = 18.57, Hbreak,2 = 19.04, γ1 = 2.41, γ2 = 1.00, and γ3 = 0.34, and the corresponding
. Right panel: the broken power-law model ℳ3 with five adjustable parameters (Hbreak,1, Hbreak,2, γ1, γ2, γ3). The best-fit values are: Hbreak,1 = 18.57, Hbreak,2 = 19.04, γ1 = 2.41, γ2 = 1.00, and γ3 = 0.34, and the corresponding ![]() . The green symbols are the currently known population of Adelaide family members from all surveys, the open black circles are the members detected during the phase 2 of CSS
. The green symbols are the currently known population of Adelaide family members from all surveys, the open black circles are the members detected during the phase 2 of CSS ![]() . The red line is the complete model
. The red line is the complete model ![]() , the blue line is the biased model (
, the blue line is the biased model (![]() ; the solid part of the blue line has
; the solid part of the blue line has ![]() objects, the same as the number of detected objects beyond the branching magnitude
objects, the same as the number of detected objects beyond the branching magnitude ![]() , the dotted part is the continuation of the biased population not used for the least-squares fitting in Eq. (2)).
, the dotted part is the continuation of the biased population not used for the least-squares fitting in Eq. (2)).
Current usage metrics show cumulative count of Article Views (full-text article views including HTML views, PDF and ePub downloads, according to the available data) and Abstracts Views on Vision4Press platform.
Data correspond to usage on the plateform after 2015. The current usage metrics is available 48-96 hours after online publication and is updated daily on week days.
Initial download of the metrics may take a while.