Fig. 15
Download original image
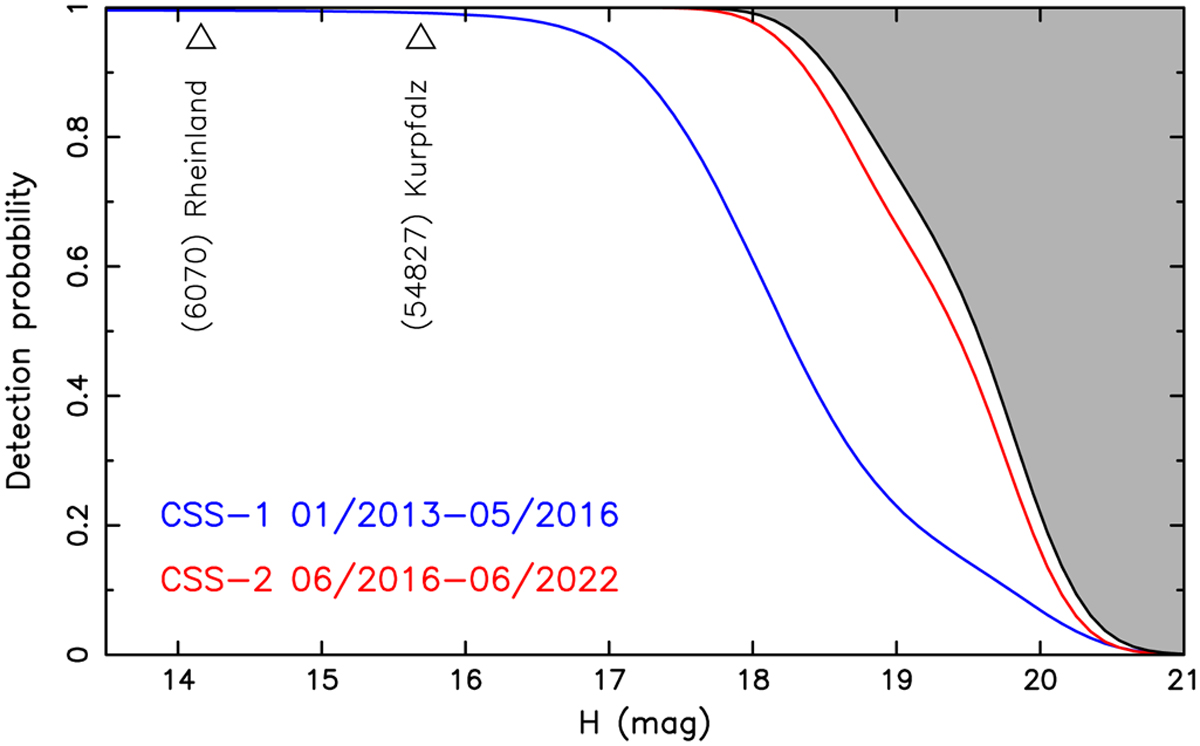
Detection probability of a companion to Rheinland and Kurpfalz on their heliocentric orbit: (i) the blue curve is p1 during the phase 1 of CSS operations, and (ii) the red curve is p2 during the phase 2 of CSS operations. The black curve is the combined probability p during both phases (Eq. (1)). The gray area allows the existence of an additional small body in the system, whose maximum probability of occurrence is complementary value to the probability p on the left ordinate.
Current usage metrics show cumulative count of Article Views (full-text article views including HTML views, PDF and ePub downloads, according to the available data) and Abstracts Views on Vision4Press platform.
Data correspond to usage on the plateform after 2015. The current usage metrics is available 48-96 hours after online publication and is updated daily on week days.
Initial download of the metrics may take a while.