Fig. 12
Download original image
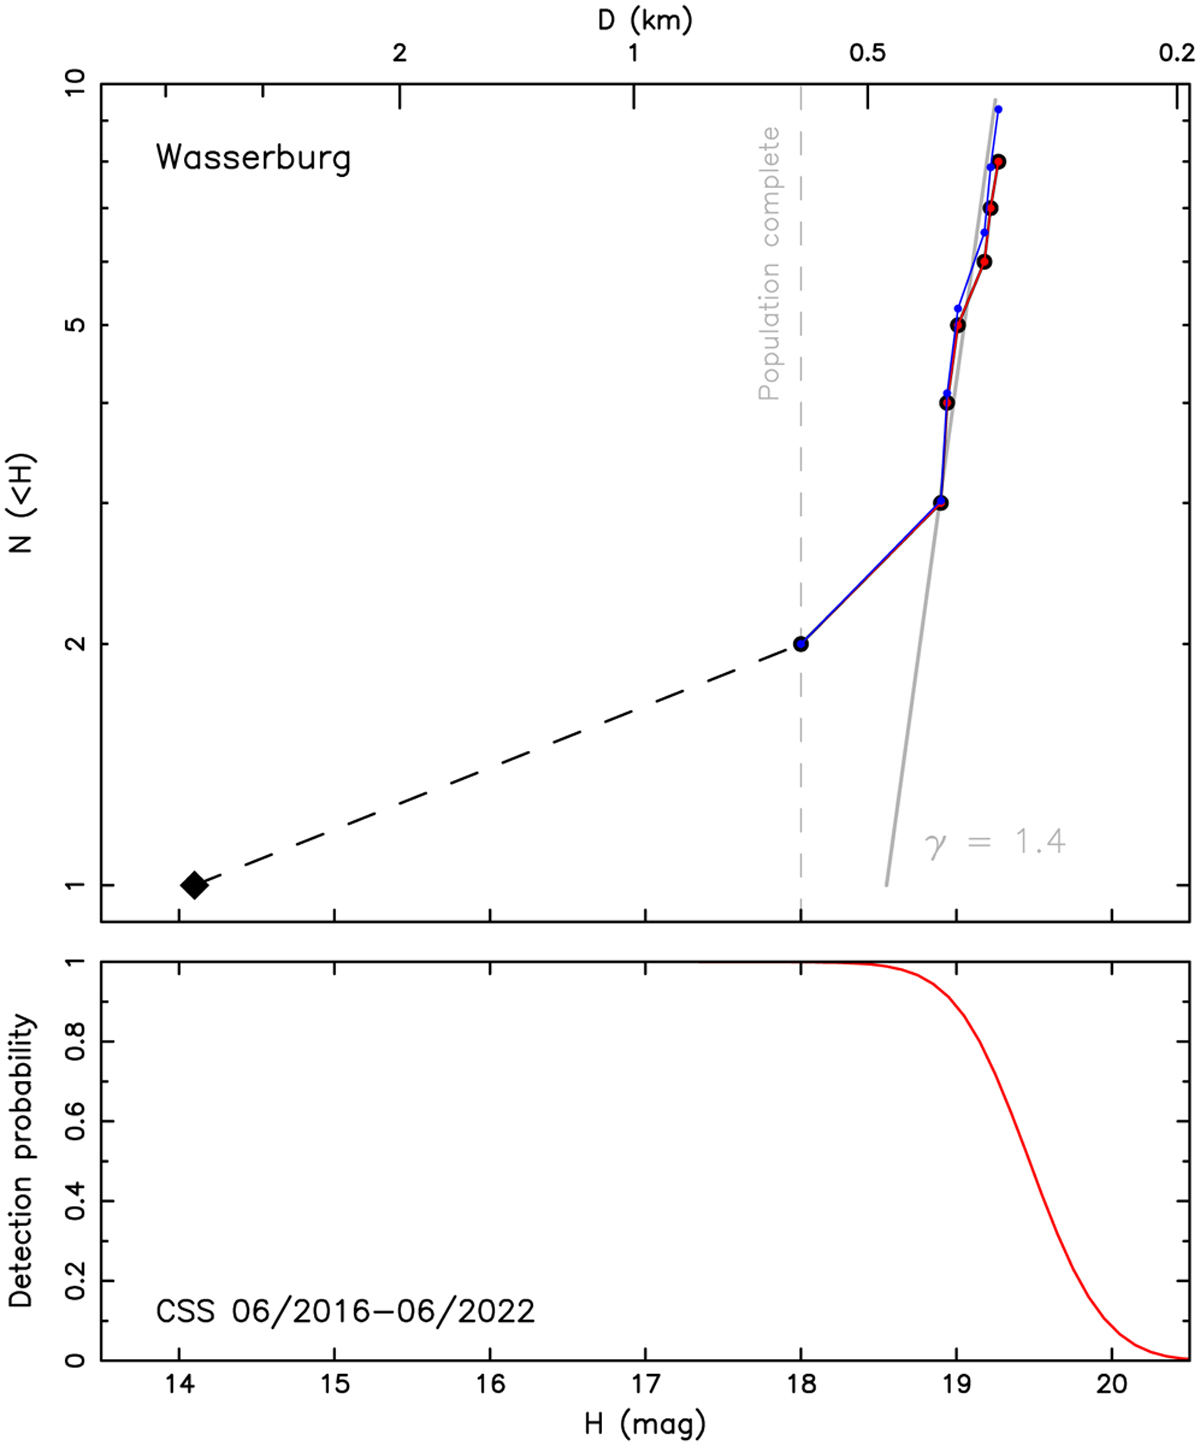
Top panel: cumulative magnitude distribution N(< H) of the Wasserburg family members. The black symbols are all 8 known members (including the largest asteroid (4765) Wasserburg shown by the diamond), the blue symbols provide the simplest variant of the debiased population. This was obtained by incrementing the population by 1/p(Hi+1), when stepping from absolute magnitude Hi to Hi+1 (i = 1,…,Nobs); the observed (biased) population increments by one by definition. The gray line is an approximate local power-law representation N(< H) ∝ 10γH near H ≃ 19 with γ ≃ 1.4. The top abscissa indicates an approximate size computed from H with an assumption of pV = 0.3 value of the geometric albedo. Bottom panel: Detection probability p(H) of Wasserburg members as a function of H during the phase 2 operations of CSS based on analysis of geometric and photometric detection factors run on a large synthetic population of Wasserburg members. We find that p = 1 up to H ≃ 18.3 magnitude, which sets the limit where the Wasserburg population is complete (dashed line on the upper panel). Beyond this limit p decreases to zero at about 20.5 magnitude.
Current usage metrics show cumulative count of Article Views (full-text article views including HTML views, PDF and ePub downloads, according to the available data) and Abstracts Views on Vision4Press platform.
Data correspond to usage on the plateform after 2015. The current usage metrics is available 48-96 hours after online publication and is updated daily on week days.
Initial download of the metrics may take a while.