Open Access
Fig. 3
Download original image
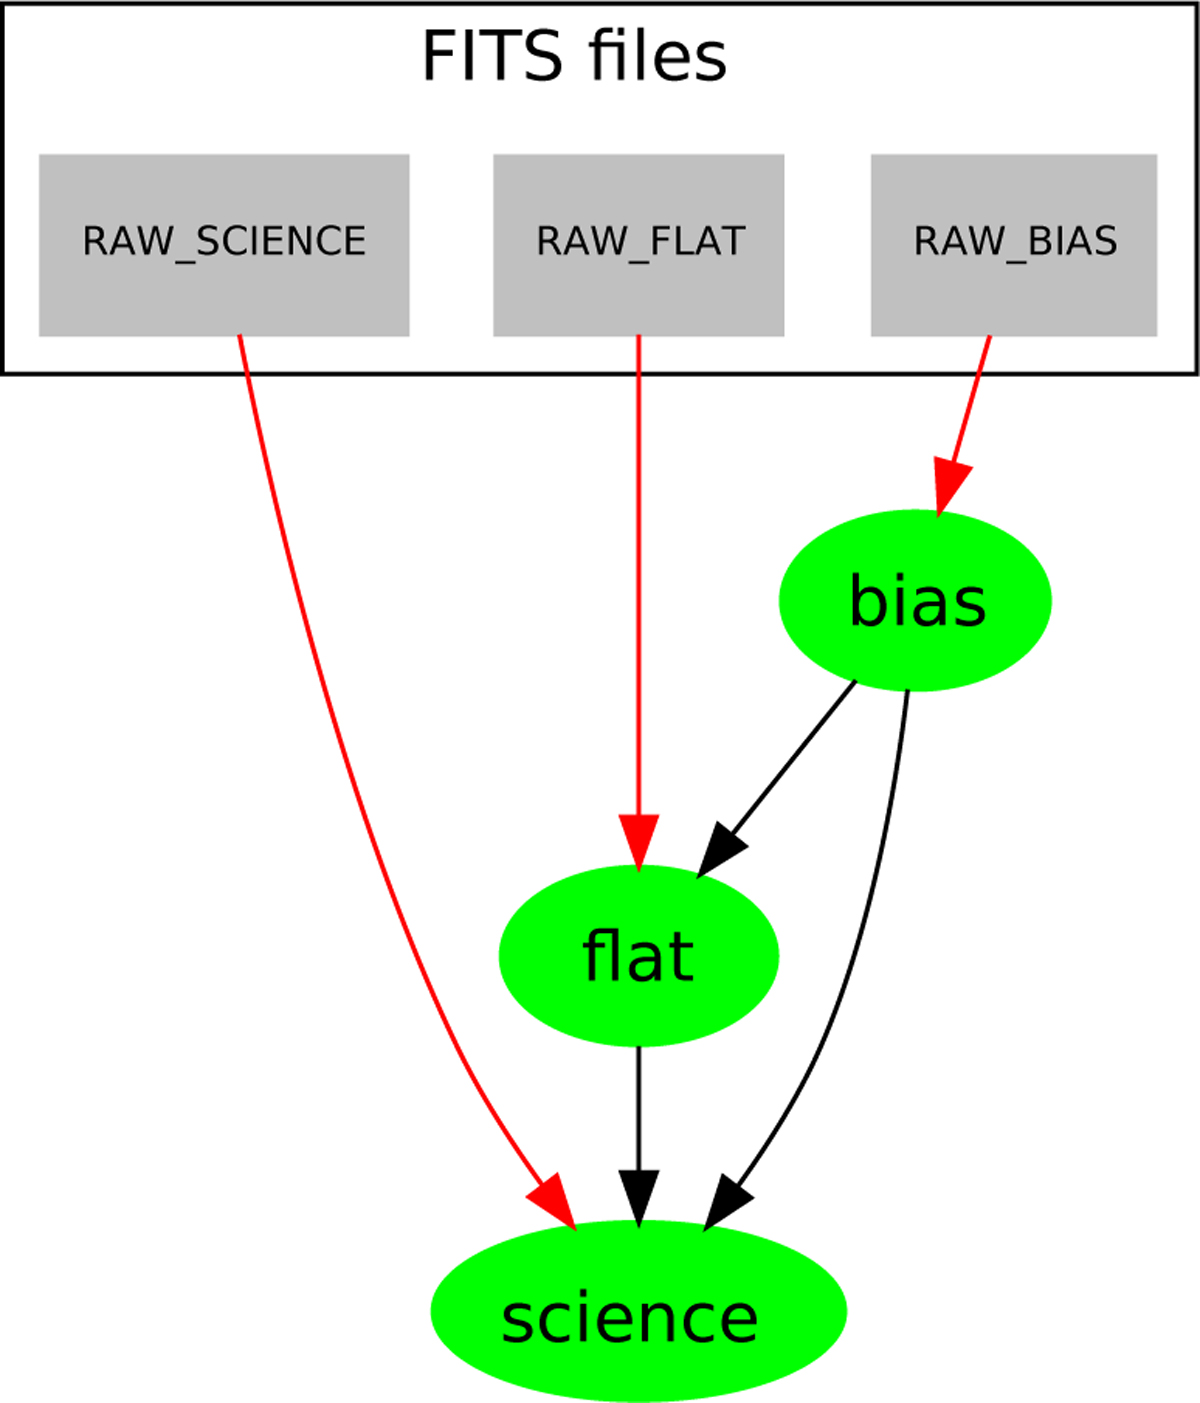
EDPS visualisation of a simple workflow corresponding to the code listing in Sect. 4.3. The green ovals are the tasks, grey squares the data sources, red arrows the main inputs and black arrows the associated inputs of the tasks.
Current usage metrics show cumulative count of Article Views (full-text article views including HTML views, PDF and ePub downloads, according to the available data) and Abstracts Views on Vision4Press platform.
Data correspond to usage on the plateform after 2015. The current usage metrics is available 48-96 hours after online publication and is updated daily on week days.
Initial download of the metrics may take a while.