Fig. 1
Download original image
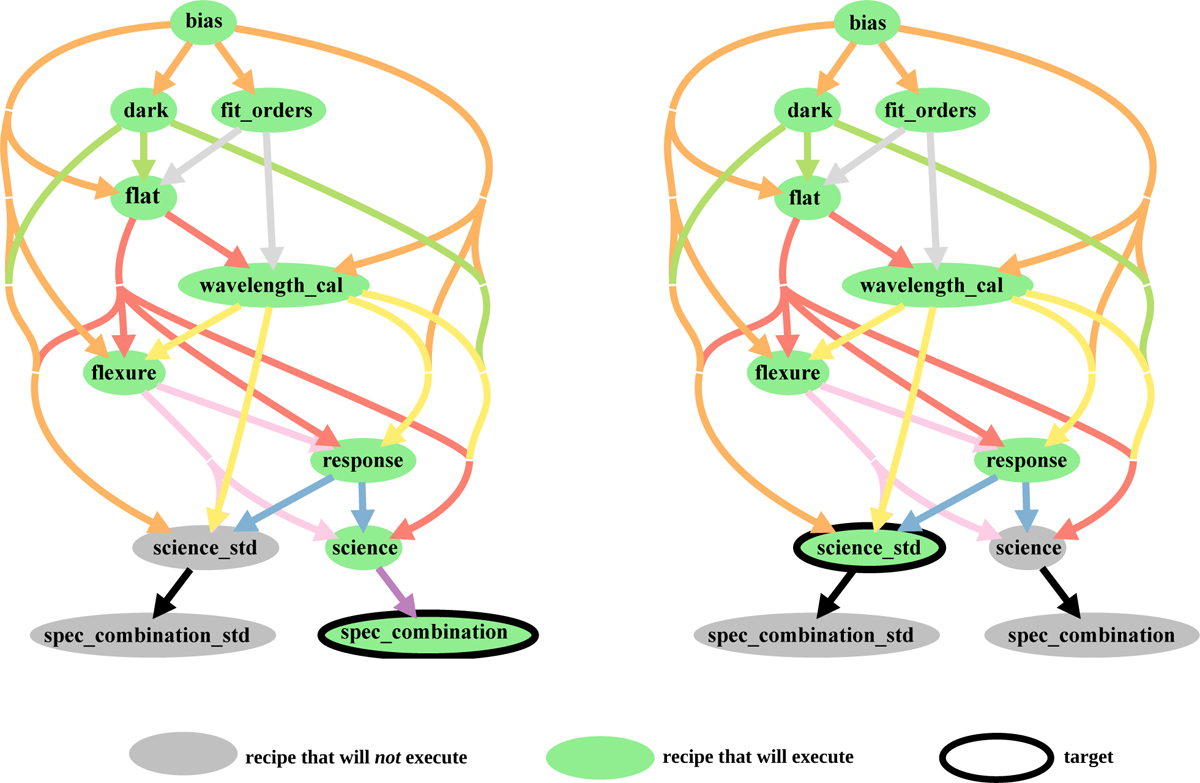
Illustration of how the target determines the processing workflow. The two trees represent the same workflow specification when used with different targets. The ellipses represent recipes, and the arrows represent the output from one recipe that is fed to subsequent recipes. The target recipe in each case is indicated by the black outline. The ellipses for recipes that are executed are in green; non-executed recipes are in grey. The corresponding file association step is shown in Fig. 2 (see text for a detailed explanation).
Current usage metrics show cumulative count of Article Views (full-text article views including HTML views, PDF and ePub downloads, according to the available data) and Abstracts Views on Vision4Press platform.
Data correspond to usage on the plateform after 2015. The current usage metrics is available 48-96 hours after online publication and is updated daily on week days.
Initial download of the metrics may take a while.