Fig. 5.
Download original image
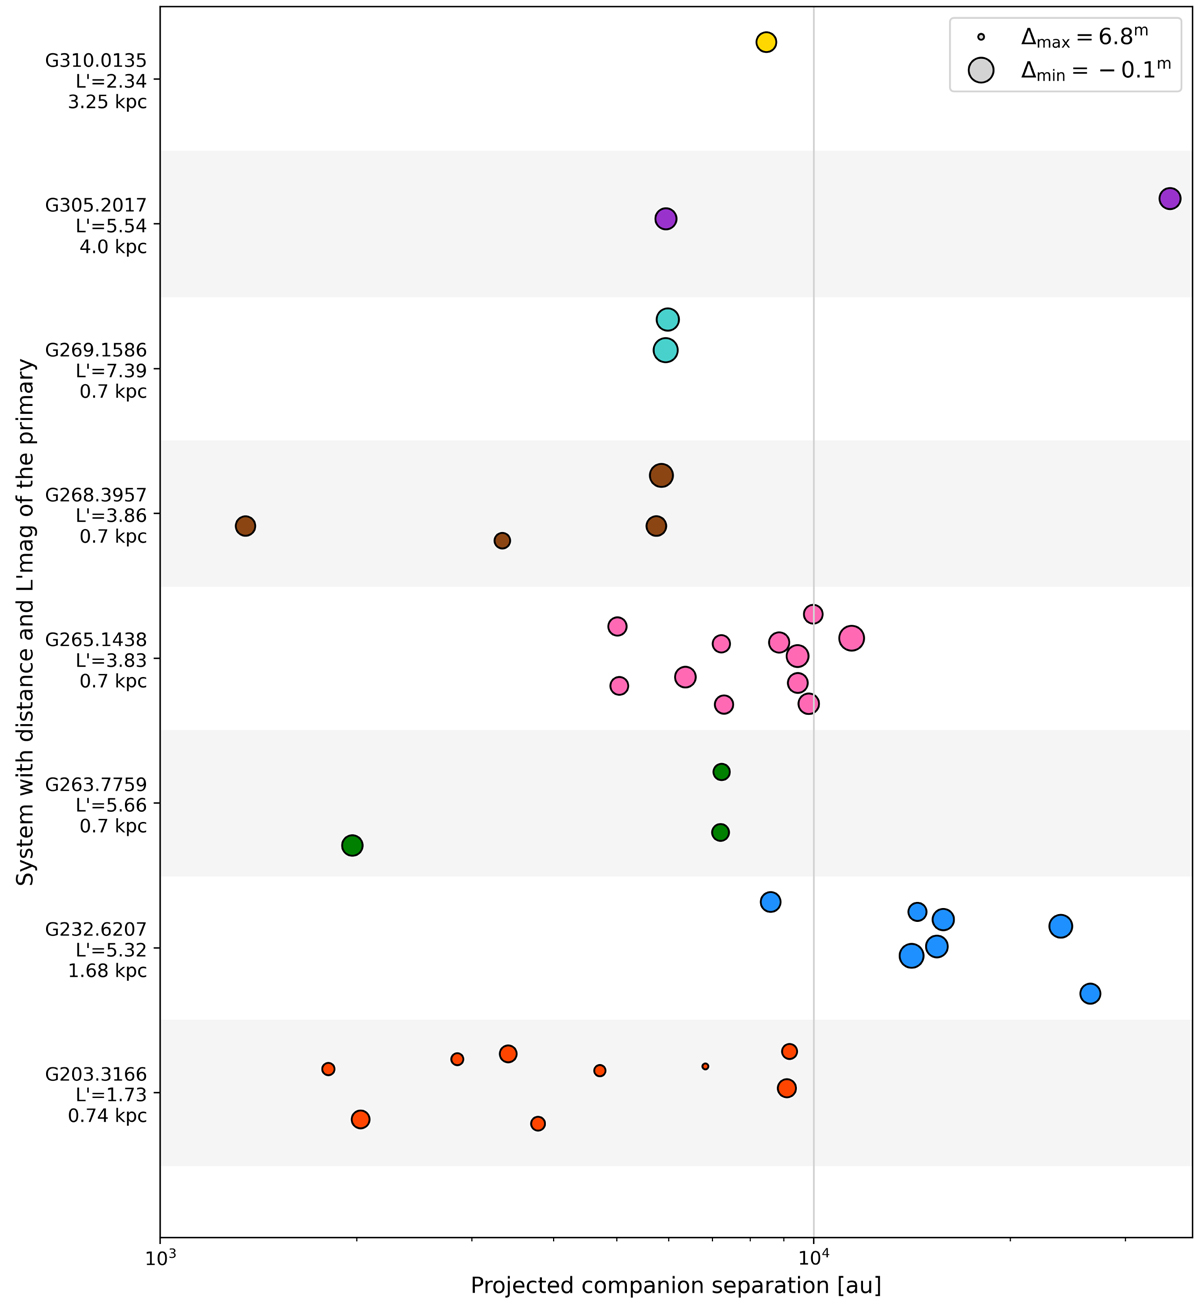
Companion separation per system with given their L′ magnitude and distance in kpc. The colours indicate different systems and the marker size scales with the magnitude difference in relation to the primary. The vertical grey line indicates the 10 000 au separation that we used as a cut earlier for a fairer comparison with other studies. Small variations in the y-direction are to avoid overlapping markers.
Current usage metrics show cumulative count of Article Views (full-text article views including HTML views, PDF and ePub downloads, according to the available data) and Abstracts Views on Vision4Press platform.
Data correspond to usage on the plateform after 2015. The current usage metrics is available 48-96 hours after online publication and is updated daily on week days.
Initial download of the metrics may take a while.