Fig. 9
Download original image
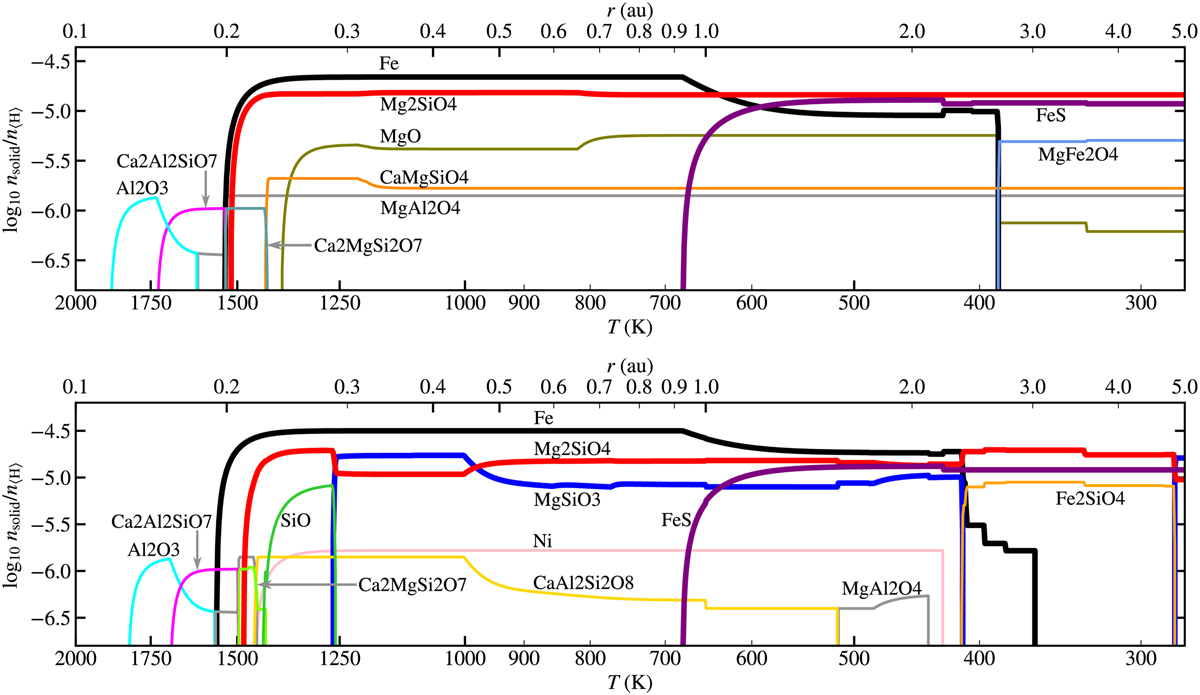
Concentration of various condensates (normalized to hydrogen atom number density) as a function of radius and temperature from our calculation using the thermo-chemical equilibrium code GGCHEM (Woitke et al. 2018). Top: plot showing the concentration using the photospheric elemental abundances of HD 144432. Bottom: plot showing the concentration using Solar elemental abundances. For clarity, we show a selection of the condensates: we plot only those species which are among the top three most abundant condensates for at least one temperature value. The T (r) relation follows our best-fit TGMdust model with iron grains. The gas pressure-temperature profile follows a power law with p = 3.16 × 10⁻² bar at the maximum temperature T = 2000 K, and p = 1.79 × 10⁻⁶ bar at the minimum temperature T = 277.5 K.
Current usage metrics show cumulative count of Article Views (full-text article views including HTML views, PDF and ePub downloads, according to the available data) and Abstracts Views on Vision4Press platform.
Data correspond to usage on the plateform after 2015. The current usage metrics is available 48-96 hours after online publication and is updated daily on week days.
Initial download of the metrics may take a while.