Fig. 5
Download original image
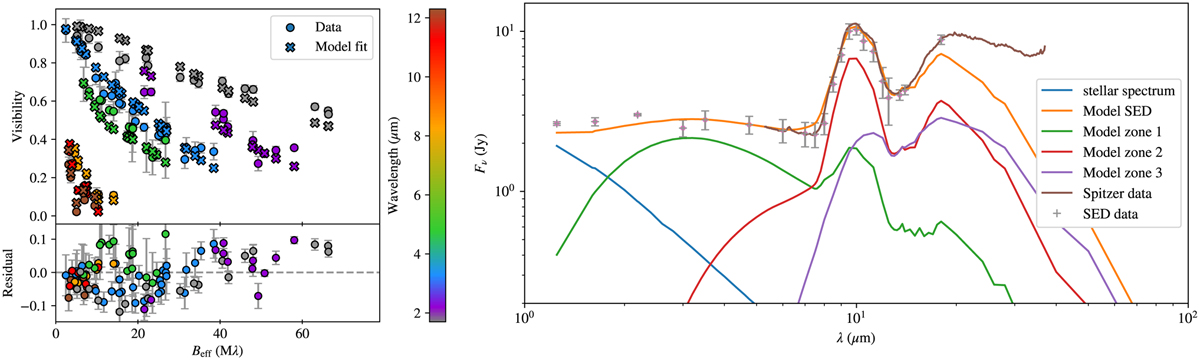
Results of the TGMdust model run with iron grains. Left panel: fit to the visibilities with respect to the effective baseline length. The points are color coded for wavelength. The following wavelengths are plotted: 1.7 µm (PIONIER, gray), 2.2 µm (GRAVITY, purple), 3.3 µm (MATISSE L, blue), 4.75 µm (MATISSE M, green), 8.3 µm (orange), 11.3 µm (red), and 12.3 µm (brown, last three are MATISSE N data). Right panel: fit to the SED. The first three data points are 2MASS JHK measurements, the three points between 3 and 5 µm are extracted from our MATISSE LM-band data, and the points between 6 and 18 µm are taken from a Spitɀer observation, except the N band where the points are the average of the Spitɀer and our MATISSE single-dish spectra.
Current usage metrics show cumulative count of Article Views (full-text article views including HTML views, PDF and ePub downloads, according to the available data) and Abstracts Views on Vision4Press platform.
Data correspond to usage on the plateform after 2015. The current usage metrics is available 48-96 hours after online publication and is updated daily on week days.
Initial download of the metrics may take a while.