Fig. 3
Download original image
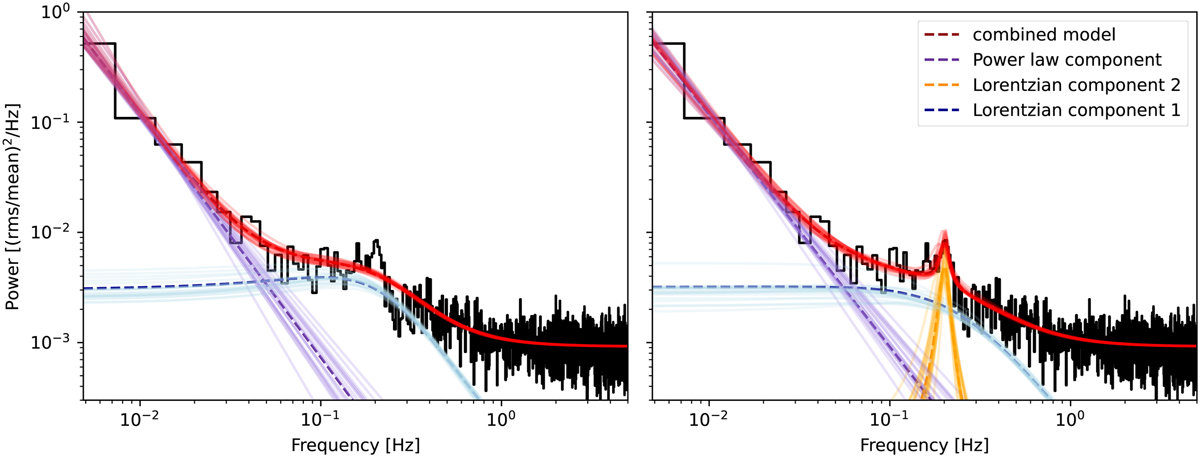
Averaged periodogram of RX J0440 data. In red, we show the combined model for ℳ1 (left) and ℳ2 (right), in purple, we show the power-law components, and in blue and orange we show the two Lorentzians (only one for ℳ1) – each of which includes a constant white noise component. Dashed lines represent the median of the posterior predictive distribution, and lightly shaded solid lines correspond to twenty individual draws from the posterior predictive distribution, for each of the model components as well as the combined model.
Current usage metrics show cumulative count of Article Views (full-text article views including HTML views, PDF and ePub downloads, according to the available data) and Abstracts Views on Vision4Press platform.
Data correspond to usage on the plateform after 2015. The current usage metrics is available 48-96 hours after online publication and is updated daily on week days.
Initial download of the metrics may take a while.