Fig. 9
Download original image
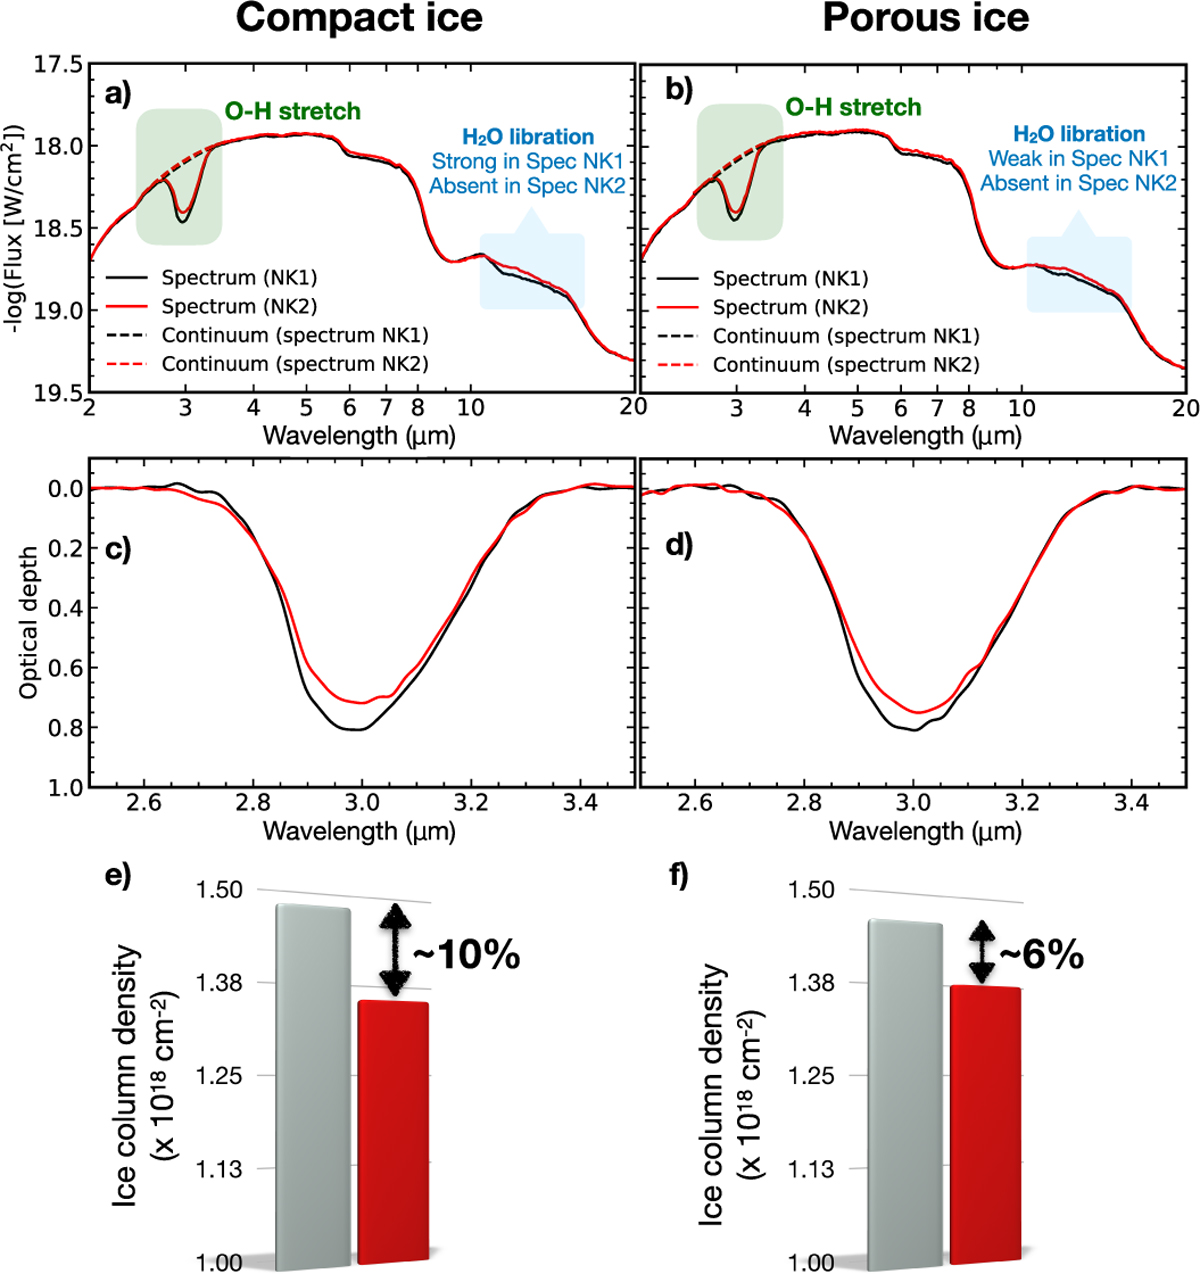
Effects of opacity values derived for grains under DHS approach by assuming NK1 and NK2 values. Panel a shows the synthetic protostellar spectrum with H2O ice and silicate absorption bands calculated from opacity models based on NK1 (black) and NK2 (red) refractive index values. The black and red and dashed lines over the 3 µm feature are the continuum. The blue box around 13 µm highlights the absence of the H2O libration band in the spectrum derived from NK2 values. Panel b displays the same as panel a but for porous ice. Panels c and d present the H2O ice column density derived from the optical depth spectrum using compact and porous ices, respectively. Finally, panels e and f compare the ice column densities from both cases (grey: NK1; red: NK2).
Current usage metrics show cumulative count of Article Views (full-text article views including HTML views, PDF and ePub downloads, according to the available data) and Abstracts Views on Vision4Press platform.
Data correspond to usage on the plateform after 2015. The current usage metrics is available 48-96 hours after online publication and is updated daily on week days.
Initial download of the metrics may take a while.