Fig. 8
Download original image
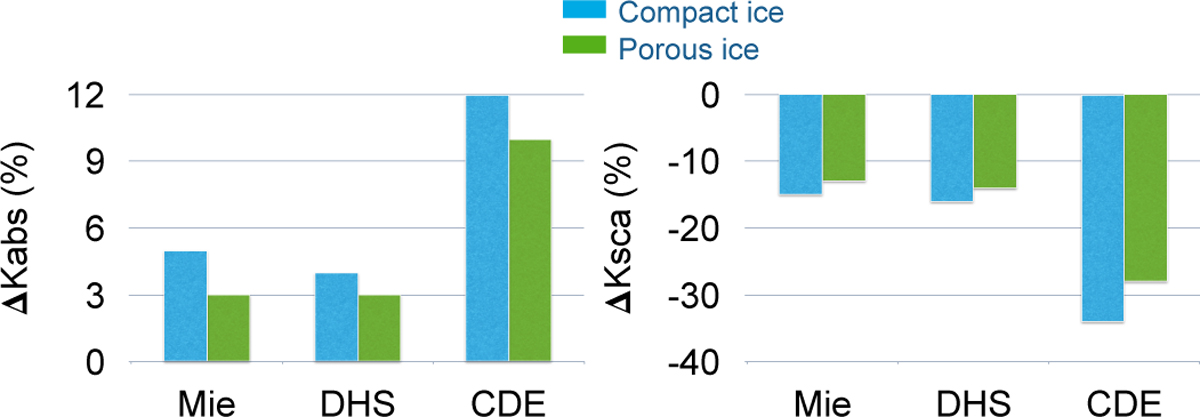
Bar plot showing percentage difference between absorption (left) and scattering (right) opacities calculated from NK1 and NK2 values for compact (blue) and porous ice (violet). The bars are grouped by the method adopted to calculate opacities, for instance, Mie, DHS, and CDE. Positive and negative values indicate an increase and decrease in the opacity value, respectively.
Current usage metrics show cumulative count of Article Views (full-text article views including HTML views, PDF and ePub downloads, according to the available data) and Abstracts Views on Vision4Press platform.
Data correspond to usage on the plateform after 2015. The current usage metrics is available 48-96 hours after online publication and is updated daily on week days.
Initial download of the metrics may take a while.