Open Access
Fig. 14
Download original image
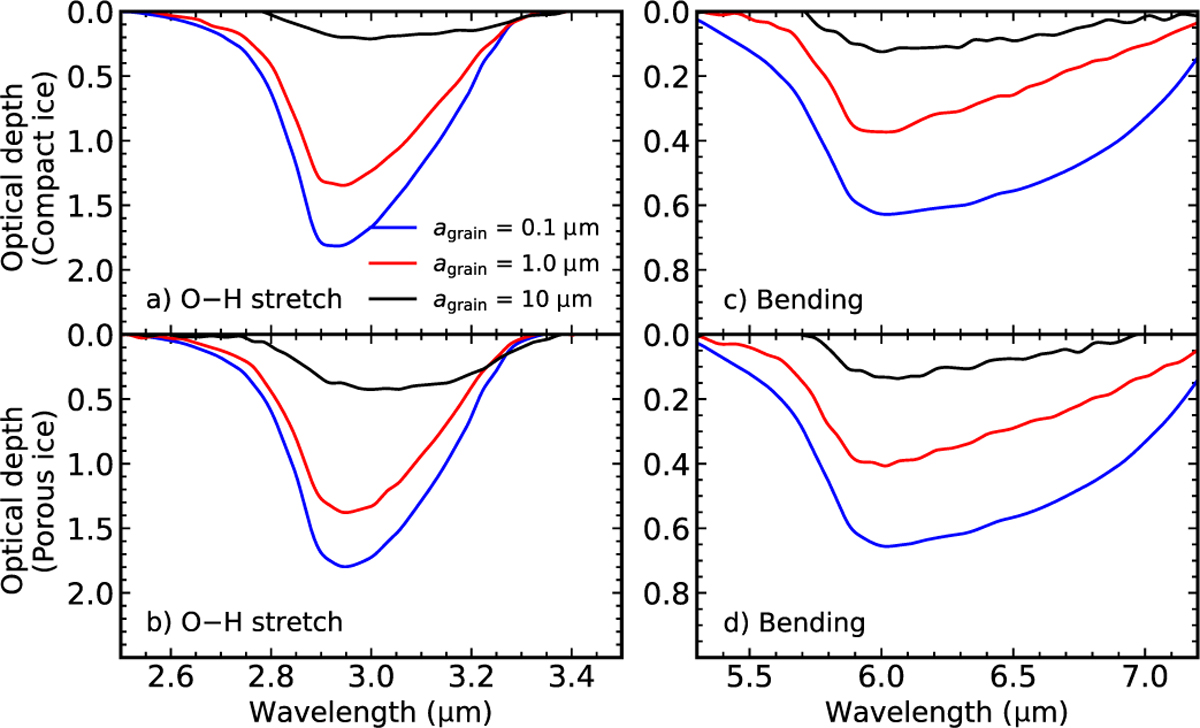
Optical depth variation with grain growth and ice porosity. Panels a and b show the changes for the O–H stretching mode, and panels c and d show the H2O ice bending mode. We note the different vertical scales for the two wavelength regimes.
Current usage metrics show cumulative count of Article Views (full-text article views including HTML views, PDF and ePub downloads, according to the available data) and Abstracts Views on Vision4Press platform.
Data correspond to usage on the plateform after 2015. The current usage metrics is available 48-96 hours after online publication and is updated daily on week days.
Initial download of the metrics may take a while.