Fig. 13
Download original image
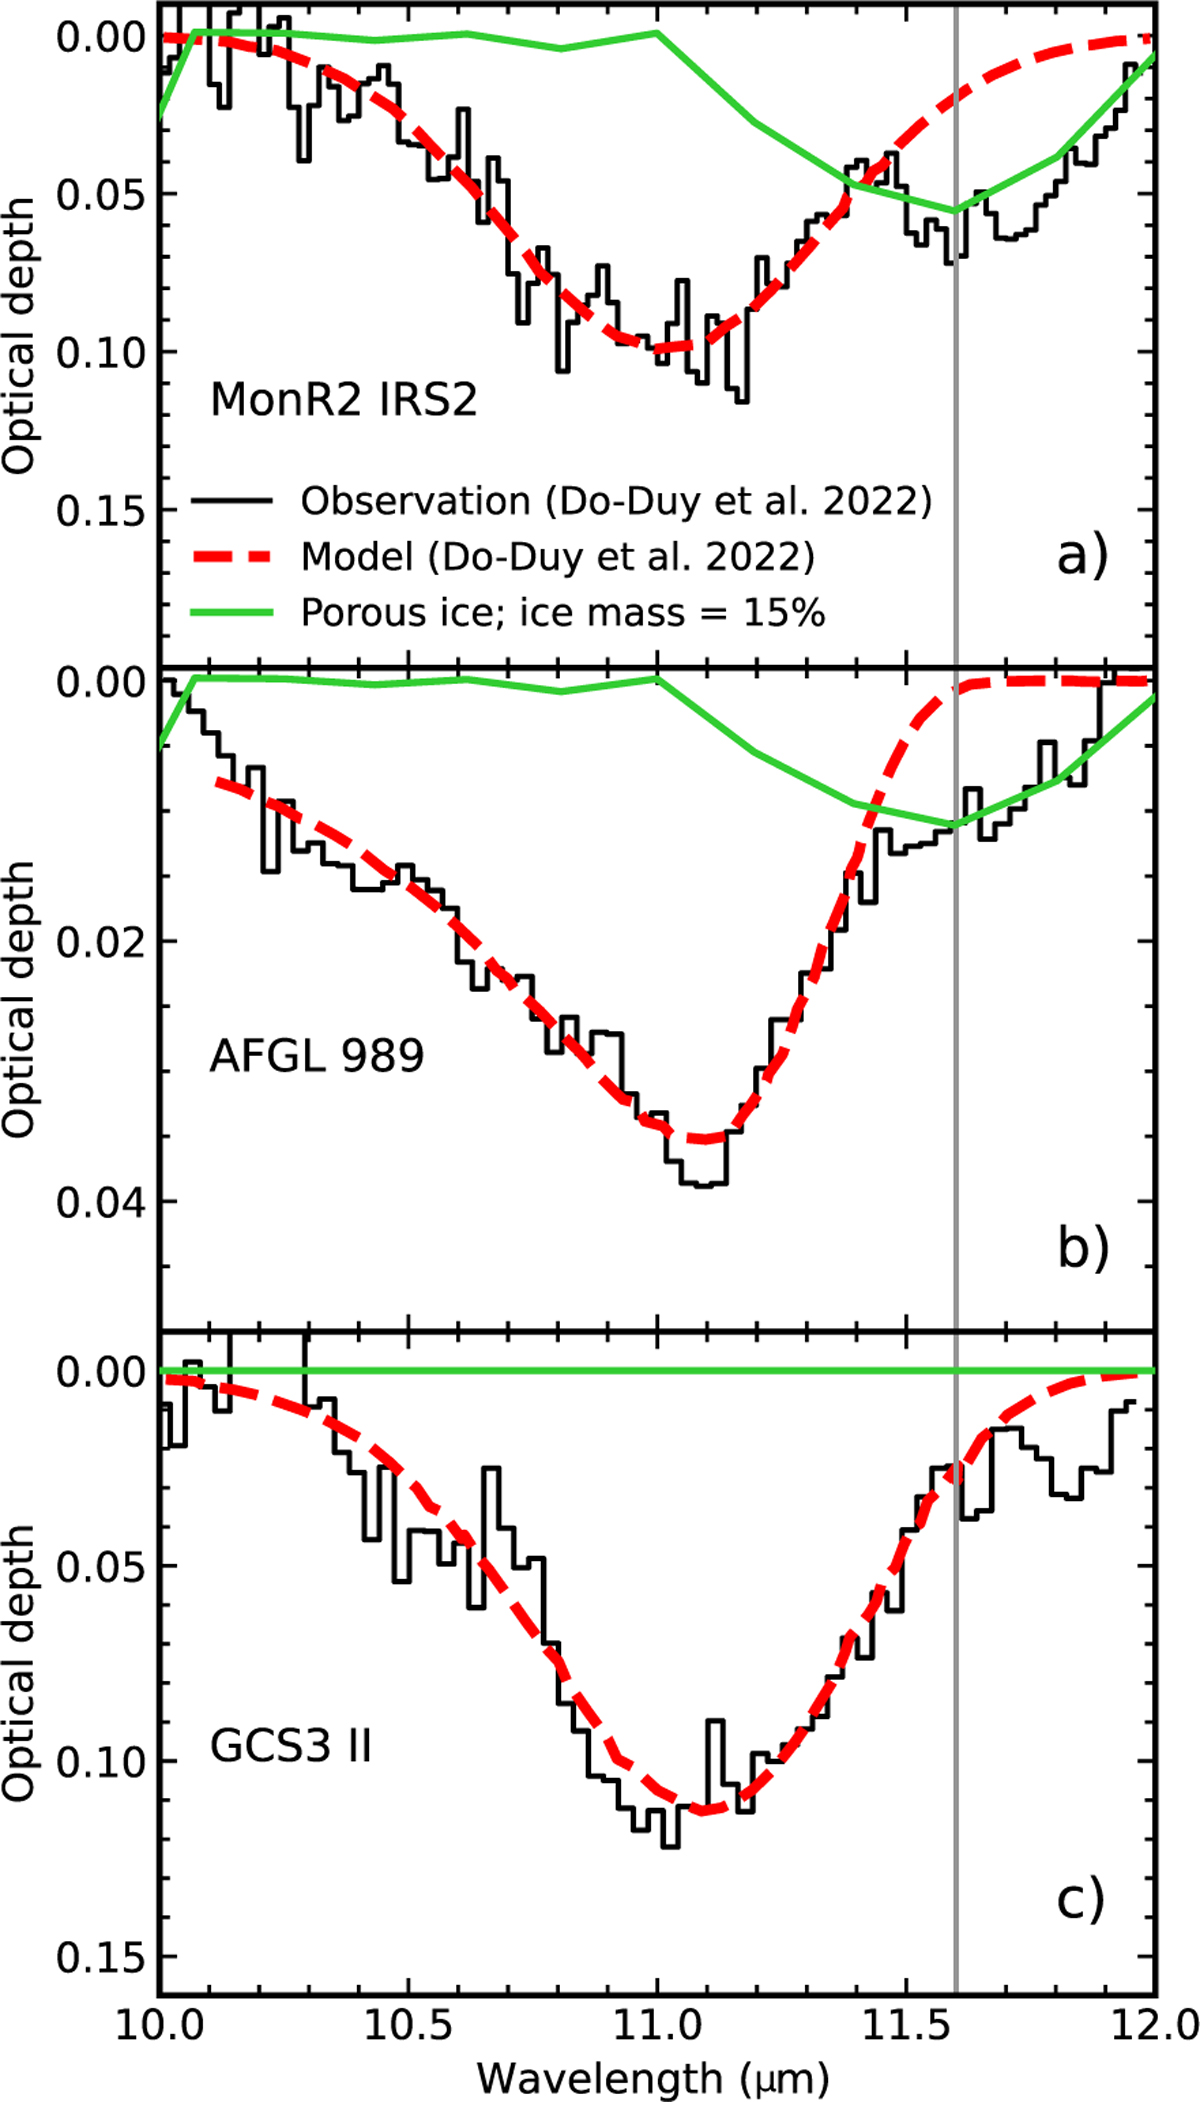
Comparison between absorption feature around 11 µm observed towards different sources with H2O ice libration band from synthetic spectra. Panels a–c show in black the profiles for the highmass protostars Monoceros R2-IRS, AFGL 989, and the galactic centre source GCS3 II, respectively. The dashed red line is an asymmetric Gaussian fit of the 11.2 µm performed by Do-Duy et al. (2020). The solid green line is the profile of the H2O ice libration band from a model assuming an ice mass of 15% distributed in porous ice and scaled to the peak optical depth at 11.6 µm, which is indicated by the vertical grey line.
Current usage metrics show cumulative count of Article Views (full-text article views including HTML views, PDF and ePub downloads, according to the available data) and Abstracts Views on Vision4Press platform.
Data correspond to usage on the plateform after 2015. The current usage metrics is available 48-96 hours after online publication and is updated daily on week days.
Initial download of the metrics may take a while.