Fig. 12
Download original image
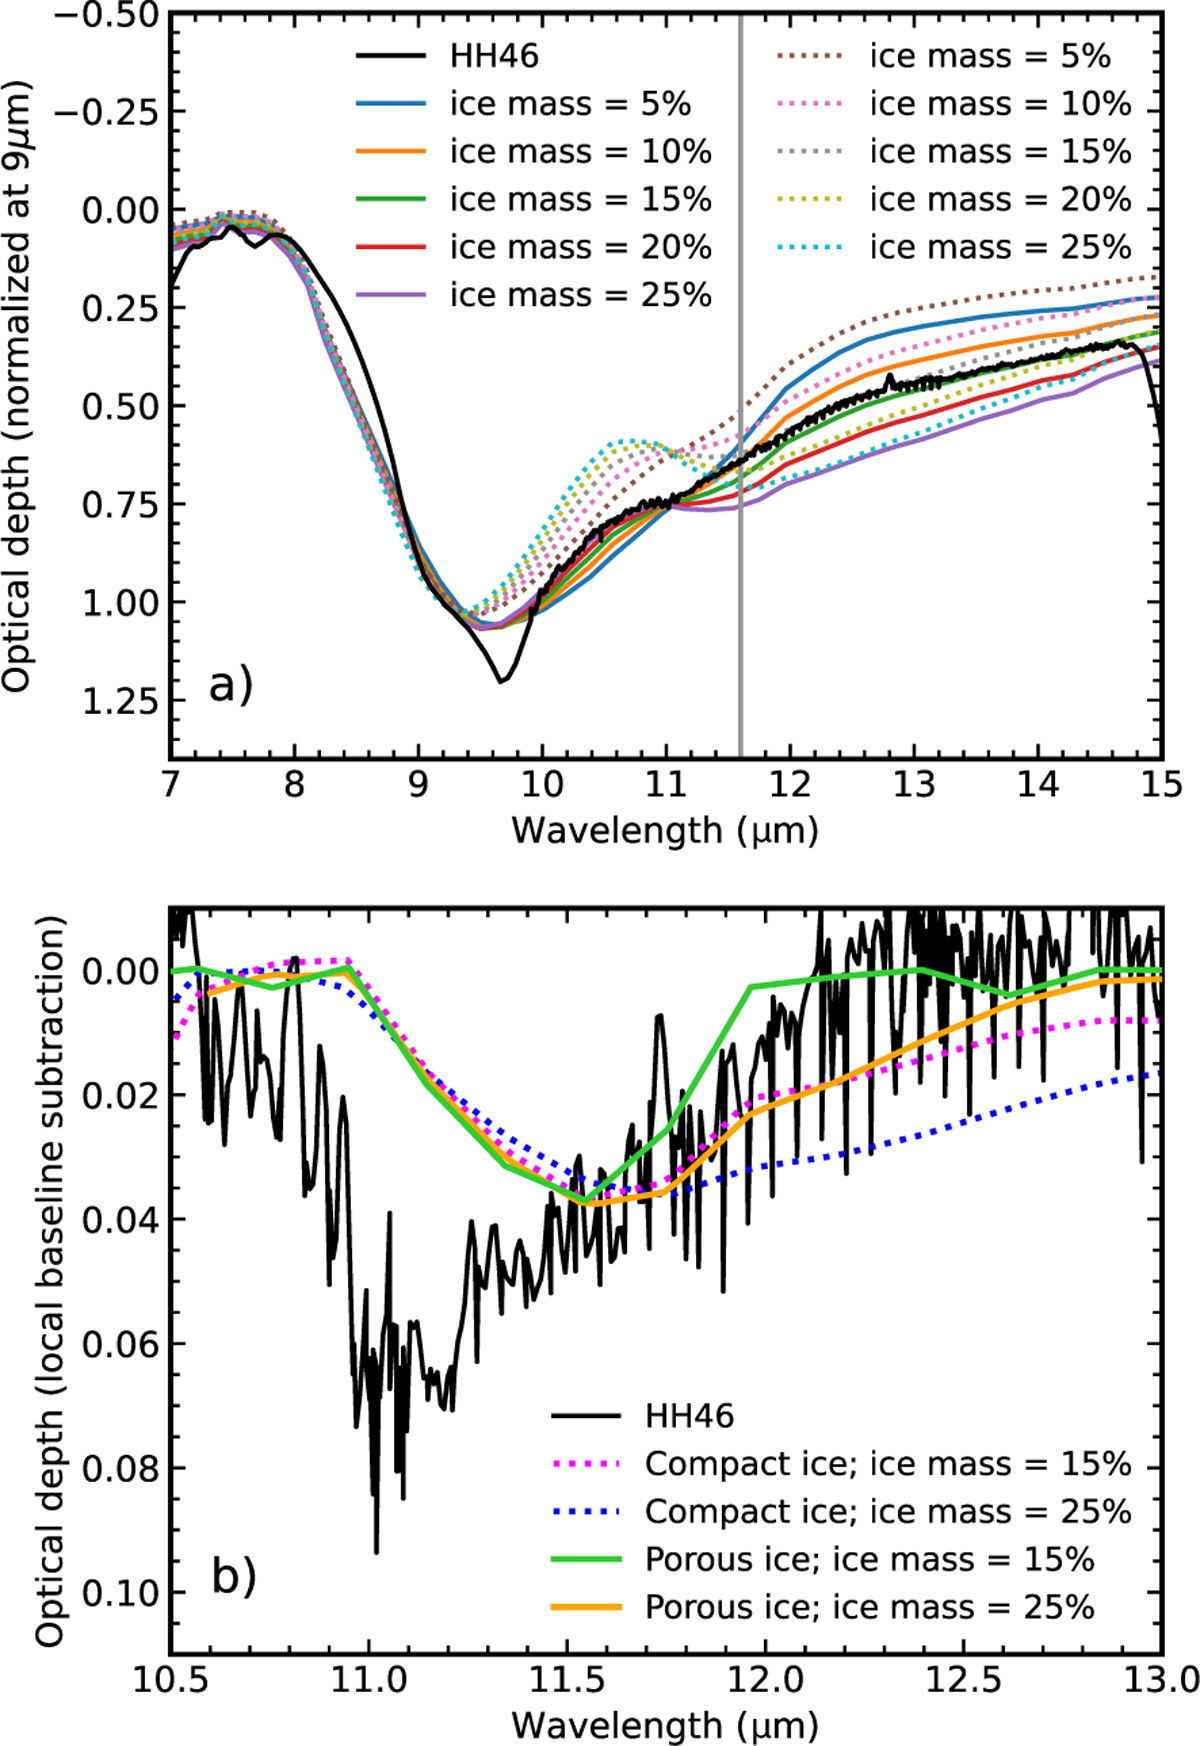
Comparisons between icy-dust models with an astronomical observation. (a) Normalised synthetic spectra in optical depth scale of models assuming compact (coloured dotted lines) and porous (coloured solid lines) ice and different ice mass. The spectrum of HH 46 is shown in black for comparison. The vertical grey line indicates the profile at 11.6 µm. (b) Comparison between the observed profile around 11.6 µm in HH 46 with four synthetic spectra after local baseline subtraction. The synthetic spectra are derived using two ice masses (15% and 25% relative to dust mass) for compact and porous ice.
Current usage metrics show cumulative count of Article Views (full-text article views including HTML views, PDF and ePub downloads, according to the available data) and Abstracts Views on Vision4Press platform.
Data correspond to usage on the plateform after 2015. The current usage metrics is available 48-96 hours after online publication and is updated daily on week days.
Initial download of the metrics may take a while.