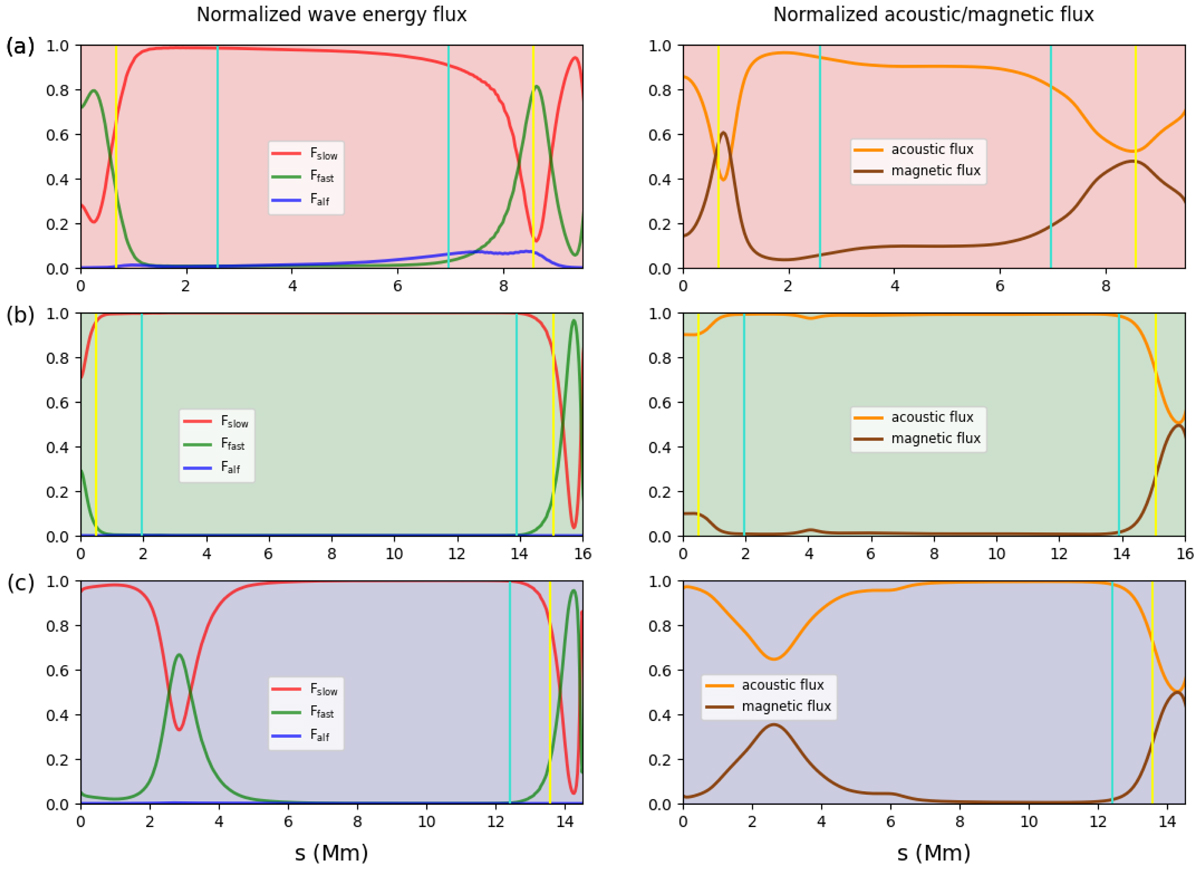
Fig. 4.
Download original image
Energy flux comparisons for the three selected flux surfaces. The surfaces are indicated as background colors: red (top row), green (middle row), and blue (bottom row). Left column: Energy fluxes associated with slow, fast, and Alfvén waves. Right column: Acoustic and magnetic fluxes. The vertical lines represent the locations of the Alfvén-acoustic equipartition layer (yellow) and the transition region (turquoise).
Current usage metrics show cumulative count of Article Views (full-text article views including HTML views, PDF and ePub downloads, according to the available data) and Abstracts Views on Vision4Press platform.
Data correspond to usage on the plateform after 2015. The current usage metrics is available 48-96 hours after online publication and is updated daily on week days.
Initial download of the metrics may take a while.