Fig. 2.
Download original image
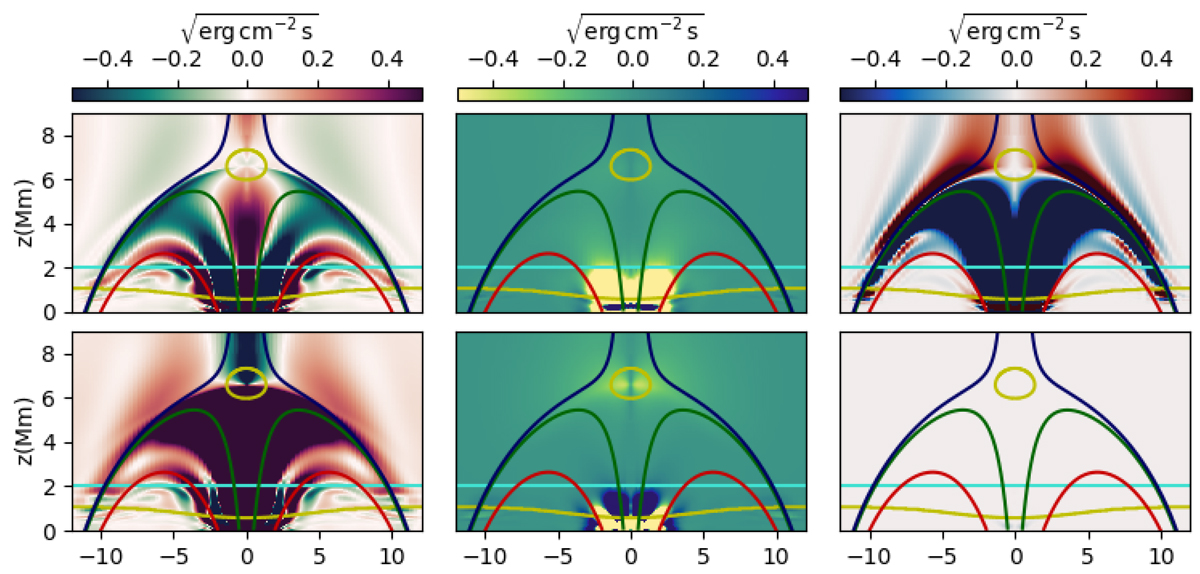
Comparison of the wave transformations between rotational and p-mode drivers. We show maps of slow waves (left column), fast waves (middle column), and Alfvén waves (right column) at one instant close to the end of our time series (i.e., ∼47 min for both simulations). The top panel shows the distribution when applying a rotational driver at the bottom boundary, and the bottom panel corresponds to vertical velocity driving.
Current usage metrics show cumulative count of Article Views (full-text article views including HTML views, PDF and ePub downloads, according to the available data) and Abstracts Views on Vision4Press platform.
Data correspond to usage on the plateform after 2015. The current usage metrics is available 48-96 hours after online publication and is updated daily on week days.
Initial download of the metrics may take a while.