Fig. 1.
Download original image
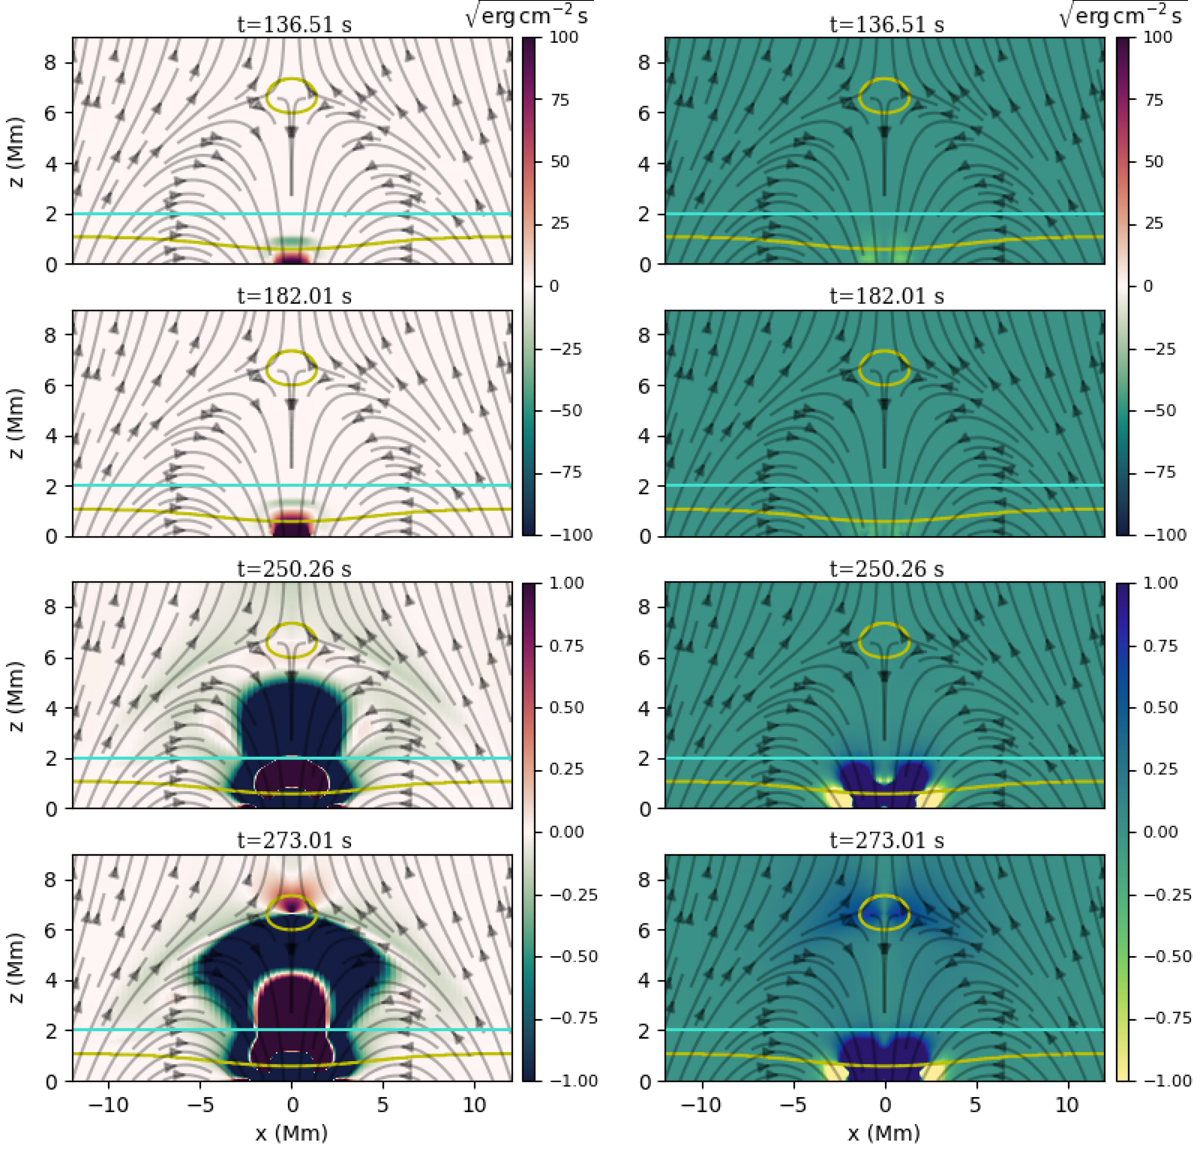
Slow- and fast-wave evolution in a vertical cutting plane through the 3D null spine. Spatial maps of slow- (left column) and fast- (right column) wave amplitudes (in terms of their associated wave energy fluxes, i.e., ![]() and
and ![]() ) in the y = 0 plane at various time instants (time evolves from top to bottom, as indicated at the top of each panel). The yellow curves represent the Alfvén-acoustic equipartition layers, and the turquoise line displays the bottom of the transition layer at z = 2 Mm. The maps are oversaturated to highlight the dynamics taking place close to these crucial layers.
) in the y = 0 plane at various time instants (time evolves from top to bottom, as indicated at the top of each panel). The yellow curves represent the Alfvén-acoustic equipartition layers, and the turquoise line displays the bottom of the transition layer at z = 2 Mm. The maps are oversaturated to highlight the dynamics taking place close to these crucial layers.
Current usage metrics show cumulative count of Article Views (full-text article views including HTML views, PDF and ePub downloads, according to the available data) and Abstracts Views on Vision4Press platform.
Data correspond to usage on the plateform after 2015. The current usage metrics is available 48-96 hours after online publication and is updated daily on week days.
Initial download of the metrics may take a while.