Fig. 5.
Download original image
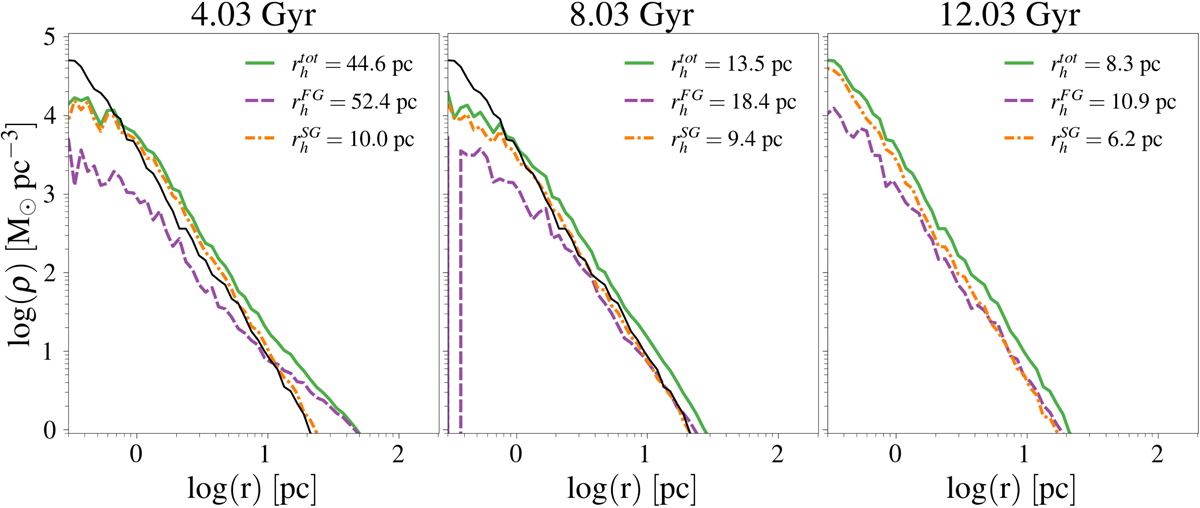
Density profiles of FG (purple, dashed), SG (orange, dash-dotted), and whole cluster (green, solid) for the model 2N7m1K at three different times, indicated above each panel. The half-mass radii of the three components are reported in the legend. The density profile at 12 Gyr of the whole cluster is reported in black, in the first two panels, for comparison.
Current usage metrics show cumulative count of Article Views (full-text article views including HTML views, PDF and ePub downloads, according to the available data) and Abstracts Views on Vision4Press platform.
Data correspond to usage on the plateform after 2015. The current usage metrics is available 48-96 hours after online publication and is updated daily on week days.
Initial download of the metrics may take a while.