Open Access
Fig. 4.
Download original image
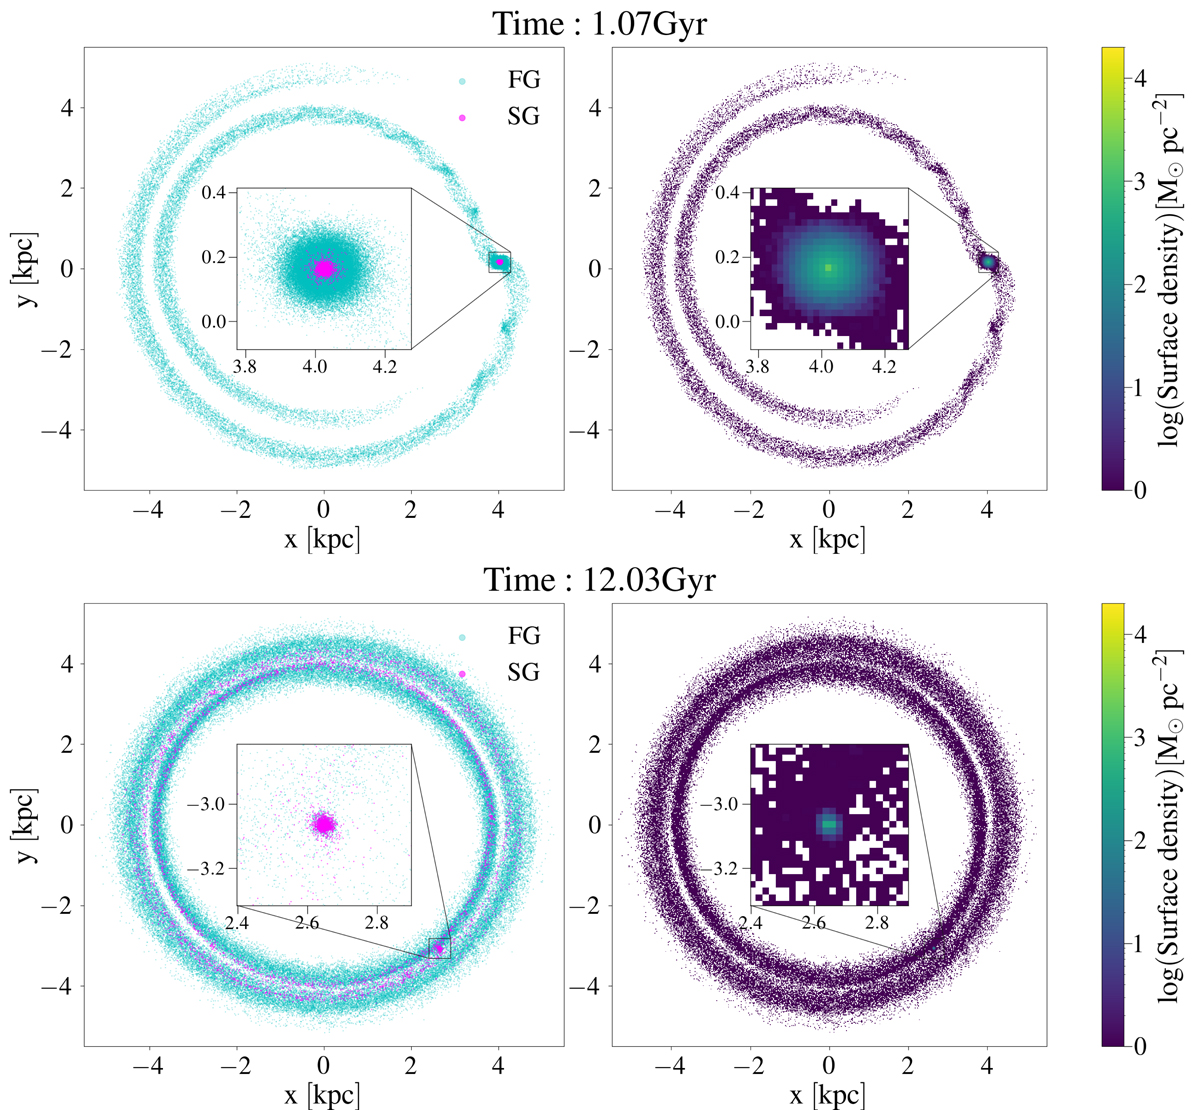
Two-dimensional maps at 1 and 12 Gyr for the model 2N7m1K. Left panel: distribution of FG (cyan) and SG (magenta). Right panel: mass surface density of whole cluster. At the centre of both panels, we show a zoomed-in image focused on the centre of mass of the cluster.
Current usage metrics show cumulative count of Article Views (full-text article views including HTML views, PDF and ePub downloads, according to the available data) and Abstracts Views on Vision4Press platform.
Data correspond to usage on the plateform after 2015. The current usage metrics is available 48-96 hours after online publication and is updated daily on week days.
Initial download of the metrics may take a while.