Open Access
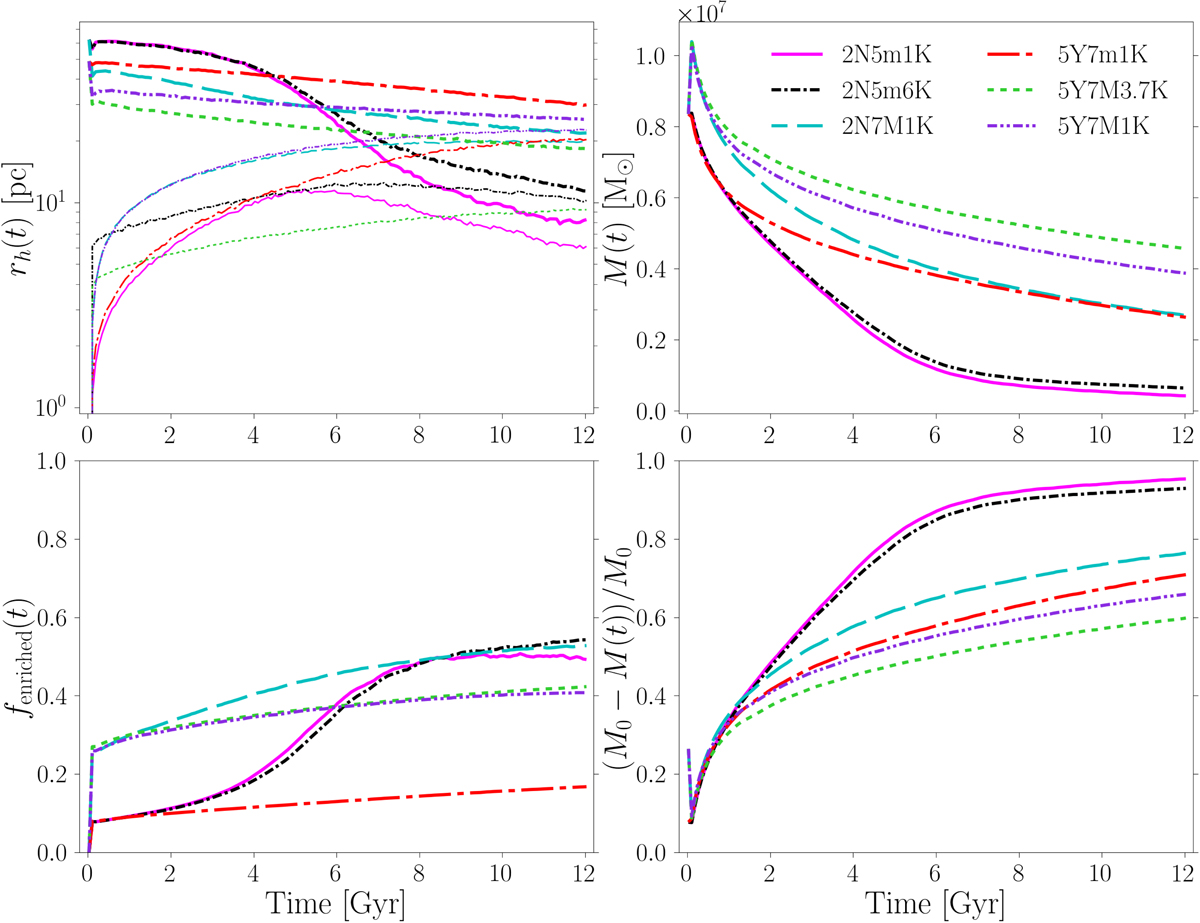
Fig. 3.
Download original image
Evolution of half-mass radius (top left), mass (top right), SG mass fraction of the whole cluster (bottom left), and mass loss (bottom right) for some of the models in Table 3 reported in the legend. The thick lines in the top panels represent the whole cluster and the thin SG.
Current usage metrics show cumulative count of Article Views (full-text article views including HTML views, PDF and ePub downloads, according to the available data) and Abstracts Views on Vision4Press platform.
Data correspond to usage on the plateform after 2015. The current usage metrics is available 48-96 hours after online publication and is updated daily on week days.
Initial download of the metrics may take a while.