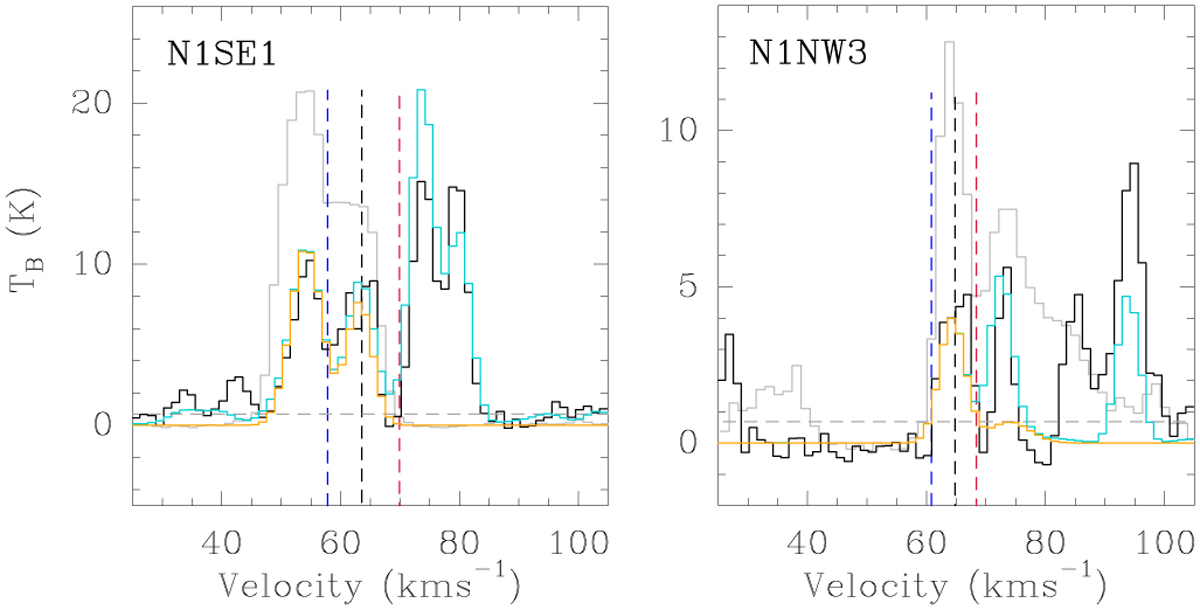
Fig. 9

Download original image
Observed spectrum of C18O J = 1−0 (black) overlaid by the respective Weeds models for both the outflow and hot-core components (orange) and the total Weeds model of all yet identified species at these positions (blue). For comparison, the grey spectrum shows the ethyl cyanide transition at 96.92 GHz scaled down by a factor 5 for N1SE1 and a factor 2 for N1NW3 (see also Fig. 5). The vertical black dashed lines mark the systemic velocities, while vertical red and blue dashed lines show the pixel-dependent inner limits used to integrate the blue-and red-shifted emission (see also Fig. 5). The grey horizontal line indicates the 3σ level, where σ = 0.23 K.
Current usage metrics show cumulative count of Article Views (full-text article views including HTML views, PDF and ePub downloads, according to the available data) and Abstracts Views on Vision4Press platform.
Data correspond to usage on the plateform after 2015. The current usage metrics is available 48-96 hours after online publication and is updated daily on week days.
Initial download of the metrics may take a while.


