Fig. 8
Download original image
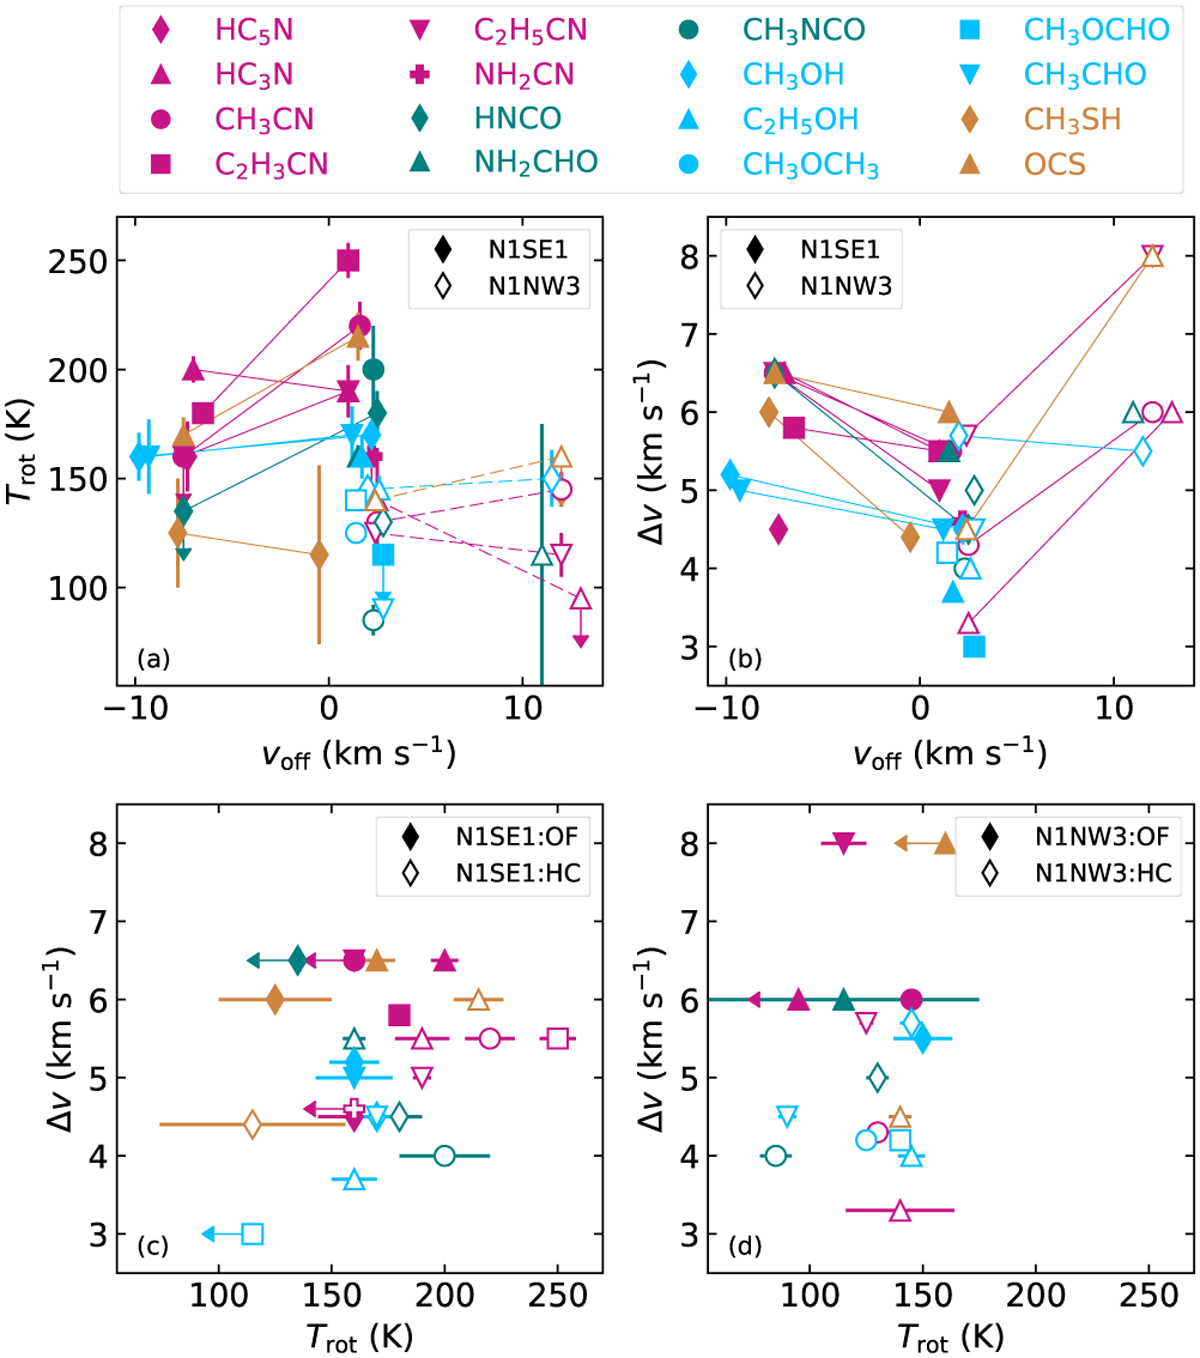
Correlation plots for Weeds model parameters. Panel a: Velocity offset, υoff, from the systemic velocity (υsys = 62 km s−1) versus rotational temperature, Trot. Panel b: υoff versus linewidth, ∆υ (FWHM). Panels c–d: Trot versus ∆υ (FWHM). Colours signify the same as in Fig. 7. Markers showing |υoff| values larger than 7 km s−1 in (a) and (b) correspond to the blue- and red-shifted components at positions N1SE1 (filled markers) and N1NW3 (empty markers), respectively. In panels c and d empty markers present the hot-core component at N1SE1 and N1NW3, respectively. Uncertainties on the temperature values are taken from the results of the population diagrams. Arrows indicate upper limits.
Current usage metrics show cumulative count of Article Views (full-text article views including HTML views, PDF and ePub downloads, according to the available data) and Abstracts Views on Vision4Press platform.
Data correspond to usage on the plateform after 2015. The current usage metrics is available 48-96 hours after online publication and is updated daily on week days.
Initial download of the metrics may take a while.