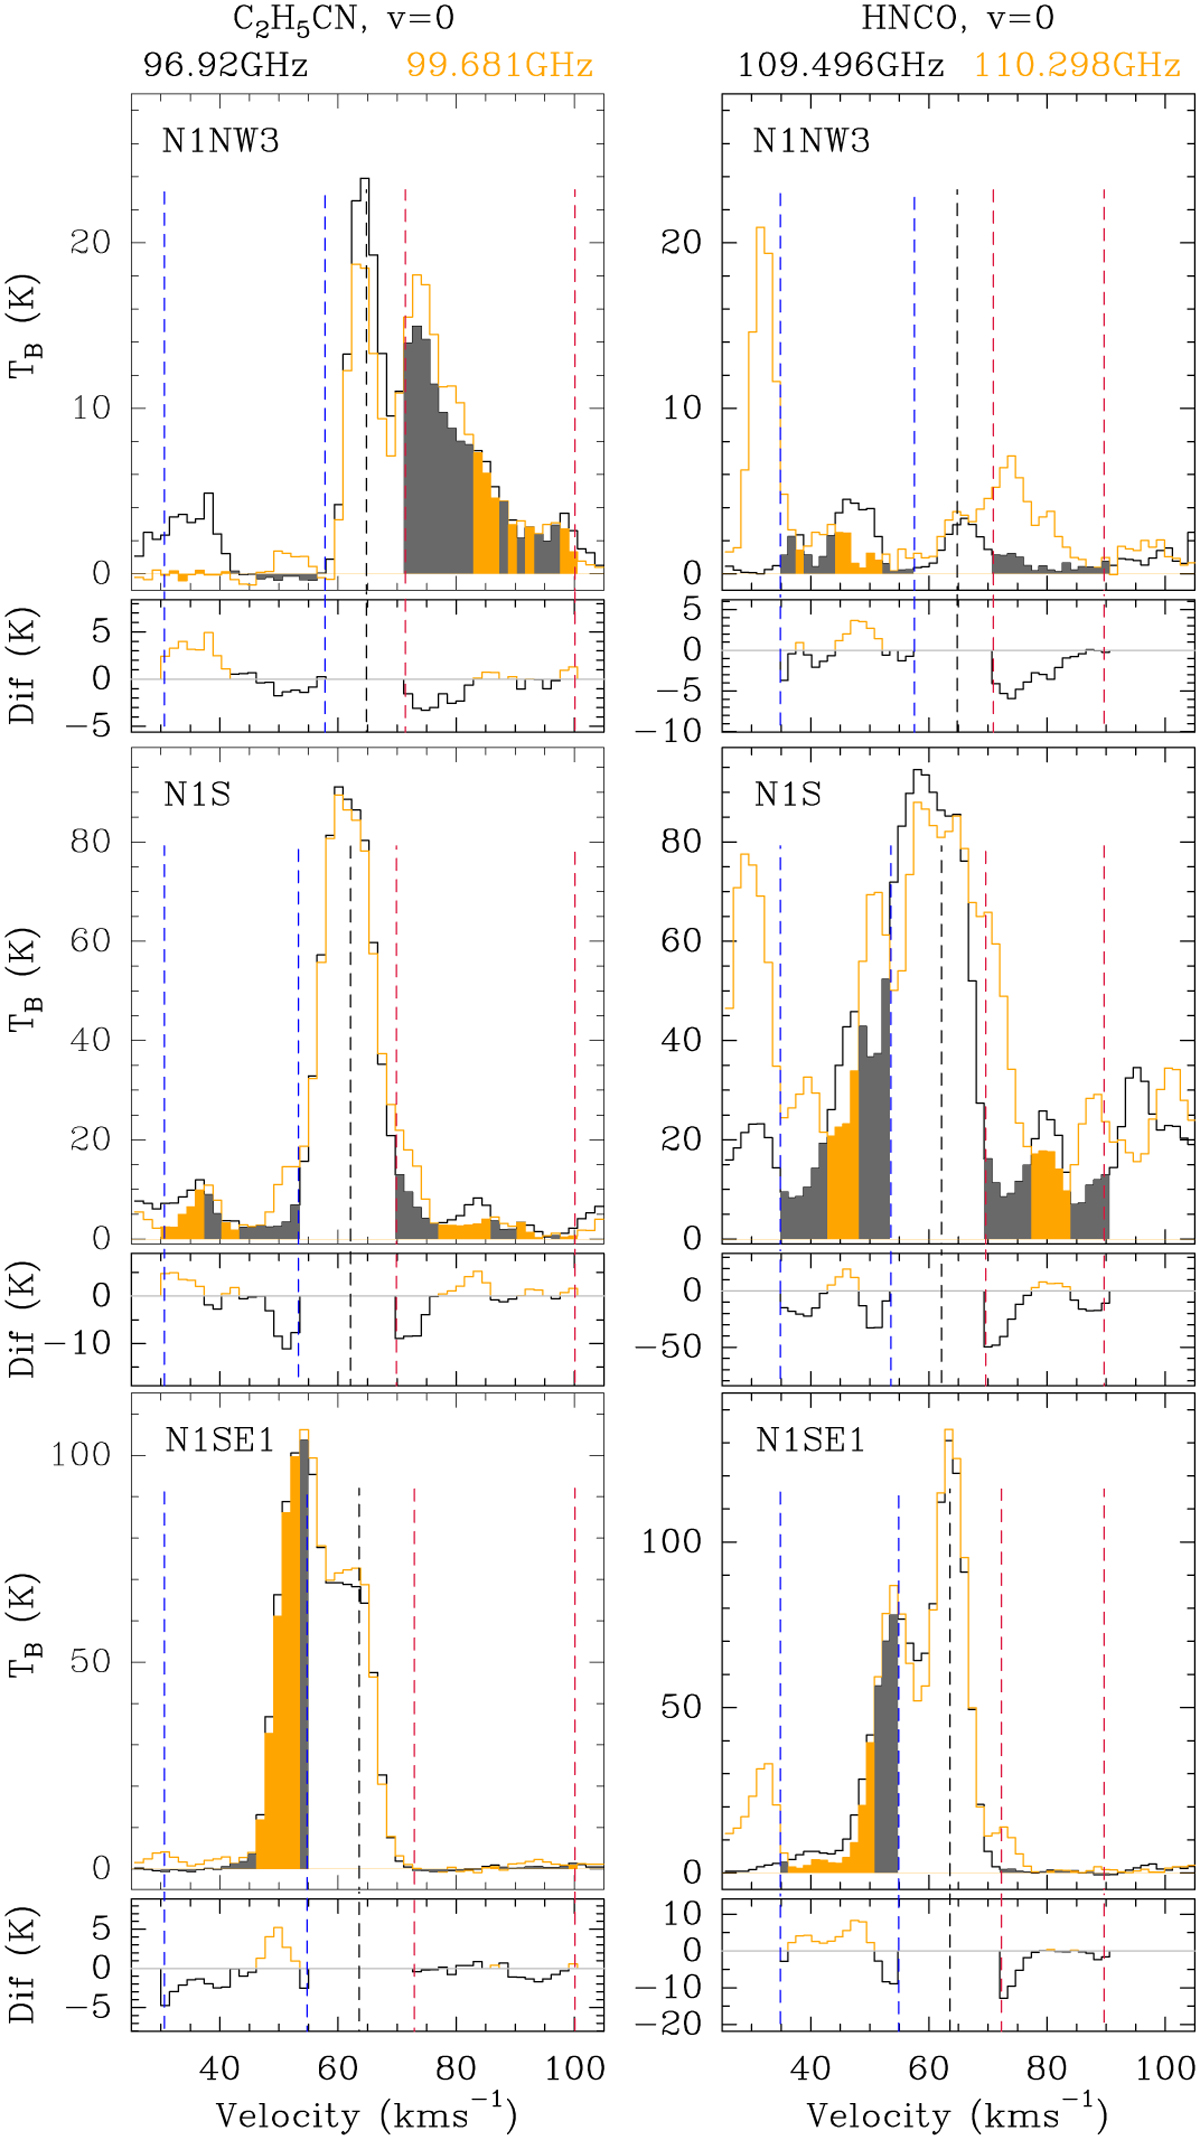
Fig. 5
Download original image
Spectra of two transitions of C2H5CN and HNCO towards a position in the red-shifted lobe (N1NW3, top row), N1S (middle row), and a position in the blue-shifted lobe (N1SE1, bottom row). The black and orange spectra show the transitions whose frequencies are given in the respective colour at the top. Additional line properties can be found in Table C.1. The black dashed lines are the same as in Fig. 3, while the dashed blue and red lines indicate the fixed outer and pixel-dependent inner limits used to integrate the blue- and red-shifted emission shown in Fig. 4. The difference (Dif) of the two spectra (black – orange) within the integration intervals is shown below the respective panel. The filled histograms and the colour of the difference spectra indicate which transition was used in each channel for the integration of the blue- and red-shifted emission in order to minimise the contamination by other species.
Current usage metrics show cumulative count of Article Views (full-text article views including HTML views, PDF and ePub downloads, according to the available data) and Abstracts Views on Vision4Press platform.
Data correspond to usage on the plateform after 2015. The current usage metrics is available 48-96 hours after online publication and is updated daily on week days.
Initial download of the metrics may take a while.