Fig. 4
Download original image
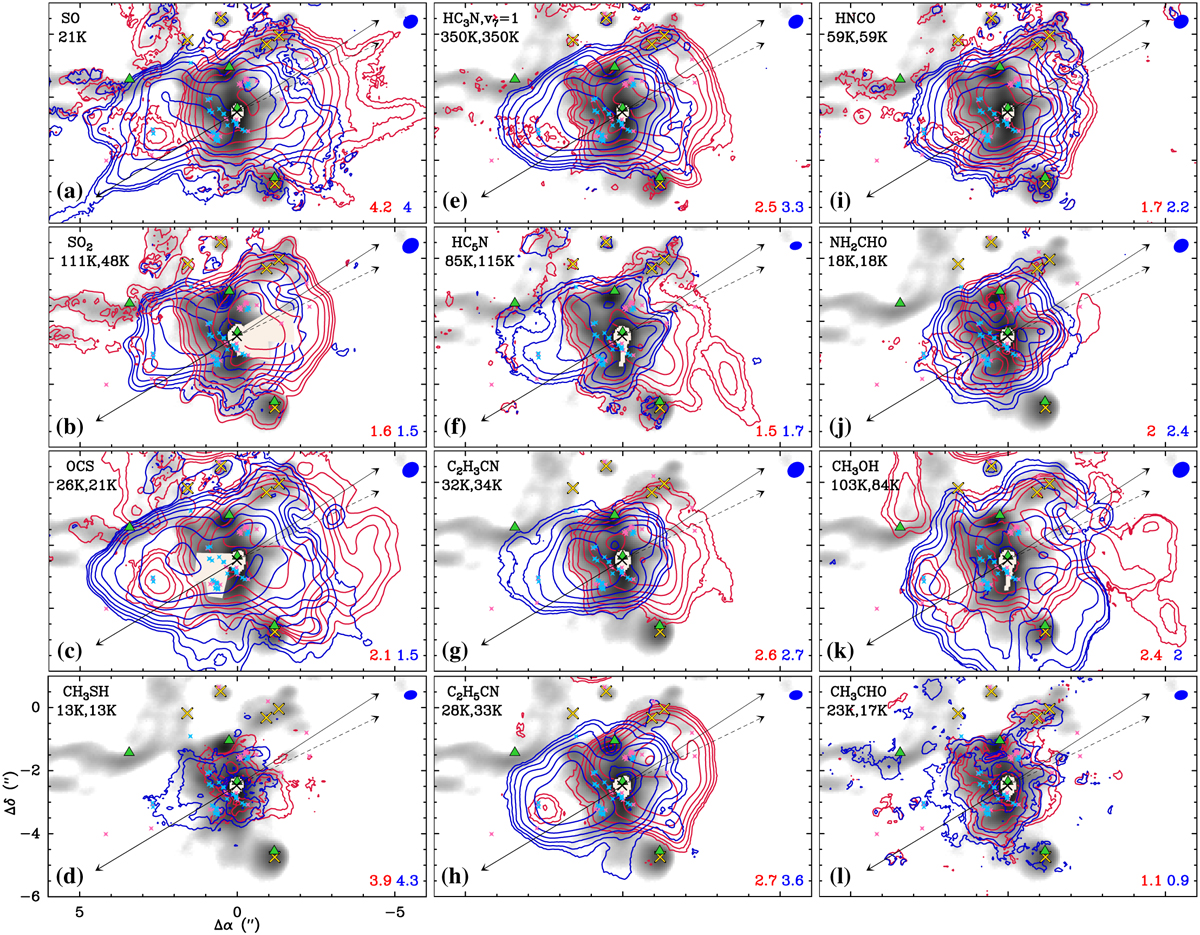
LVINE maps of blue- and red-shifted emission (blue and red contours, respectively) of S-bearing molecules (a–d), N-bearing molecules (e–h), and (N+O)- and O-bearing species (i–l). The contour steps start at 5σ and then increase by a factor of 2, where σ is an average noise level measured in an emission-free region in each map and is given in K km s−1 in the bottom right corner in each panel. The grey scale in all panels shows the continuum emission at 99 GHz (see Fig. 2). The closest region around Sgr B2 (N1) is masked out (beige areas) due to high frequency- and beam-size-dependent continuum optical depth (see Appendix C in Paper I). For OCS and SO2, masked regions were extended due to contamination by emission of other species that were identified in their spectra. Markers and arrows are the same as in Fig. 2. The upper-level energies of the transitions used to produce the maps are shown in the top left corner in each panel. Other properties of the transitions and the outer integration limits are summarised in Table C.1. The HPBW is shown in the top right corner in each panel. The position offsets are given with respect to the ReMoCA phase centre.
Current usage metrics show cumulative count of Article Views (full-text article views including HTML views, PDF and ePub downloads, according to the available data) and Abstracts Views on Vision4Press platform.
Data correspond to usage on the plateform after 2015. The current usage metrics is available 48-96 hours after online publication and is updated daily on week days.
Initial download of the metrics may take a while.