Fig. F.3
Download original image
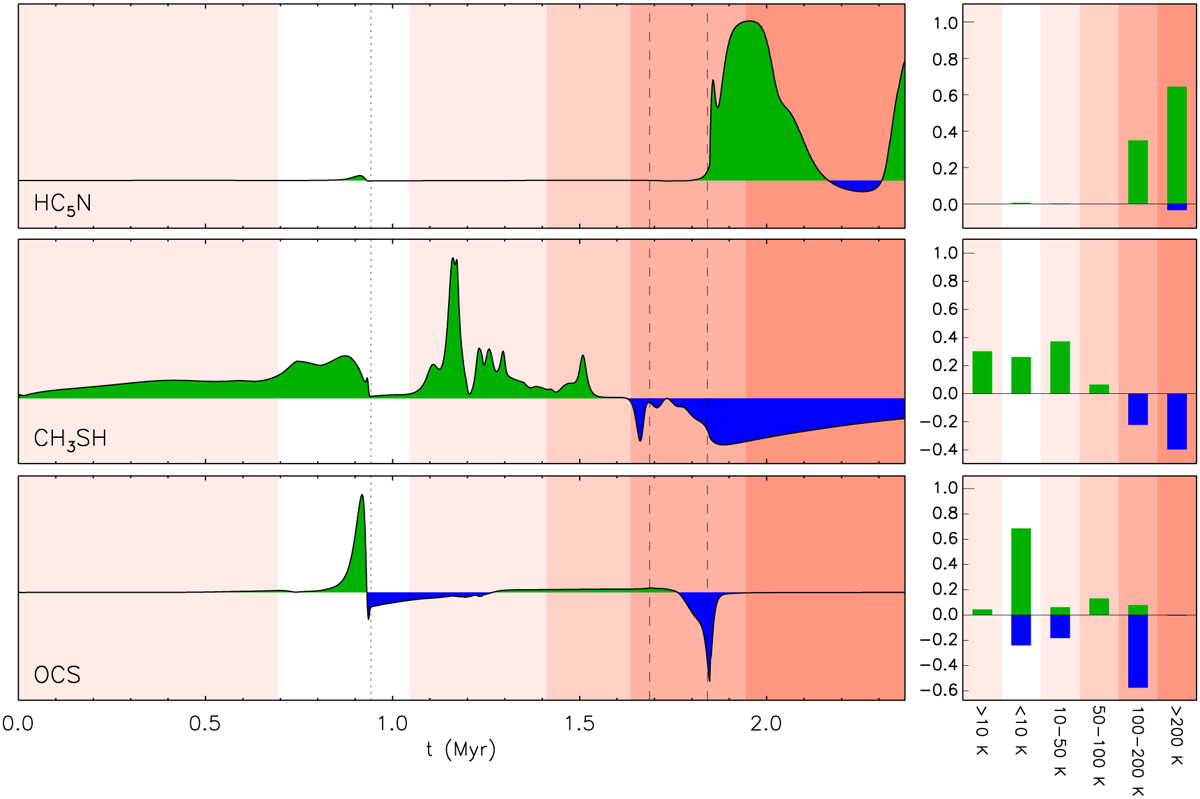
Same as Fig. 13 in Garrod et al. (2022), but for HC5N, CH3SH, and OCS. It shows the net rate of change in the COM’s abundances, summed over all chemical phases, during the cold collapse phase and the subsequent slow warm-up. Green represents a net production of the molecule, blue a net destruction. The time axis is divided into several phases marked with different background colours that are associated with the temperature ranges labelled in the right panels. The dotted black line marks the start of the warm-up phase, the two dashed lines indicate the time of thermal desorption of water.
Current usage metrics show cumulative count of Article Views (full-text article views including HTML views, PDF and ePub downloads, according to the available data) and Abstracts Views on Vision4Press platform.
Data correspond to usage on the plateform after 2015. The current usage metrics is available 48-96 hours after online publication and is updated daily on week days.
Initial download of the metrics may take a while.