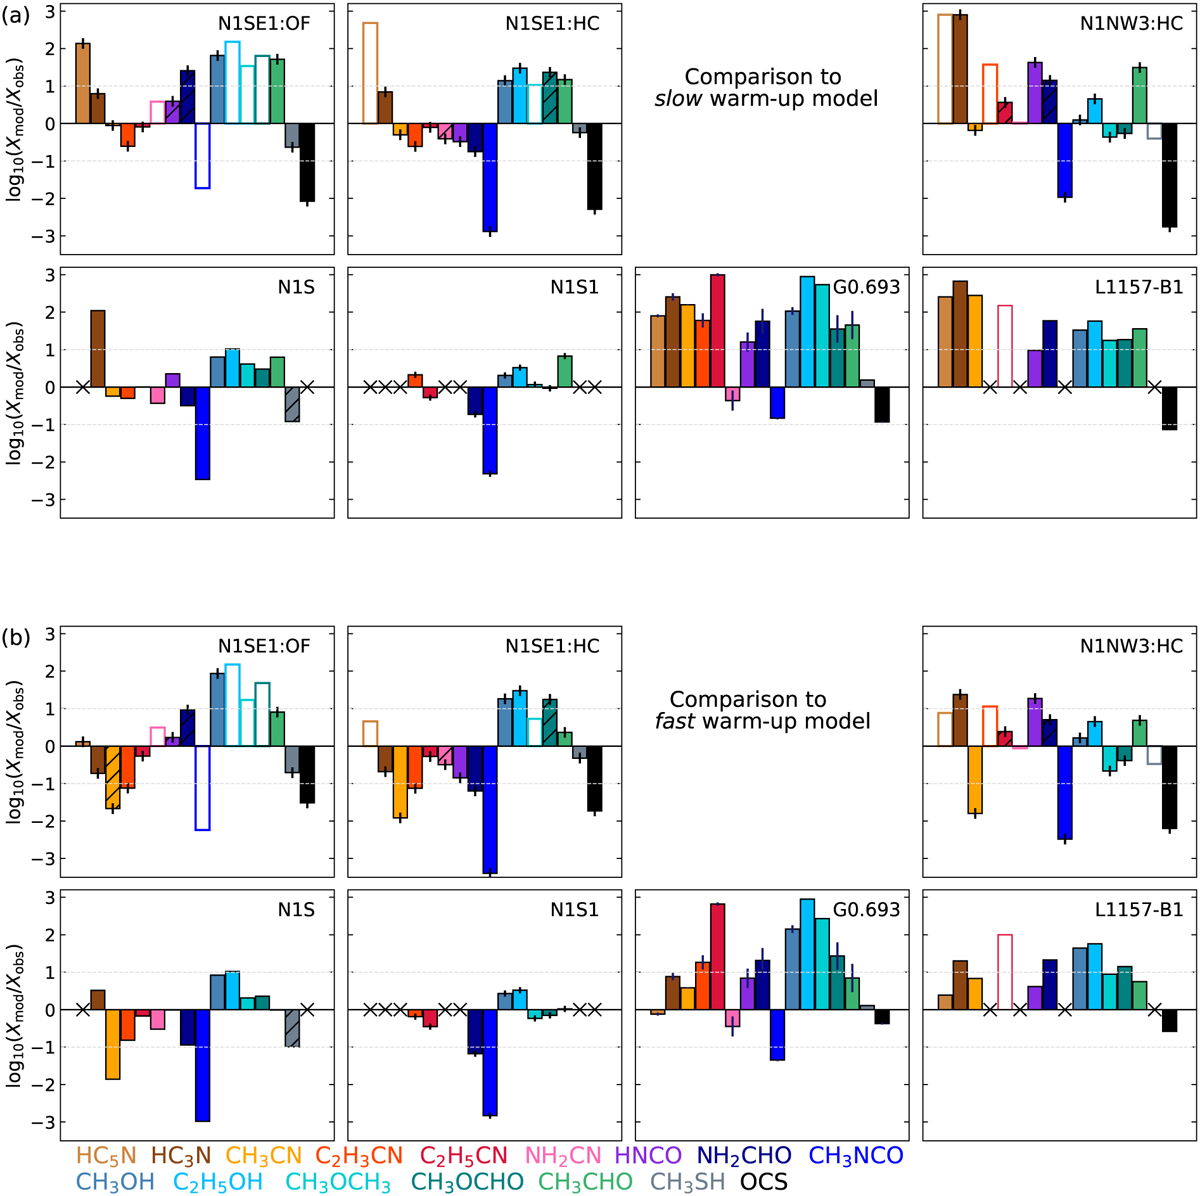
Fig. F.1
Download original image
Comparison between modelled peak abundances with respect to H2 and the observed abundances towards both components at N1SE1 and N1NW3:HC, N1S, N1S1, G0.693, and L1157-B1. For all observed values in SgrB2(N1), H2 column densities were derived from C18O emission, except for N1S, for which dust emission was used. The modelled abundances Xmod are taken from Table 17 in Garrod et al. (2022), where we use the values of the slow (a) and fast (b) warm-up models, and multiplied by a factor 2 to roughly convert to abundances with respect to H2 (from total H). Empty bars indicate lower limits. Hatched bars indicate the same as in Fig. 10. Black crosses indicate molecules for which no values are available.
Current usage metrics show cumulative count of Article Views (full-text article views including HTML views, PDF and ePub downloads, according to the available data) and Abstracts Views on Vision4Press platform.
Data correspond to usage on the plateform after 2015. The current usage metrics is available 48-96 hours after online publication and is updated daily on week days.
Initial download of the metrics may take a while.