Fig. D.6
Download original image
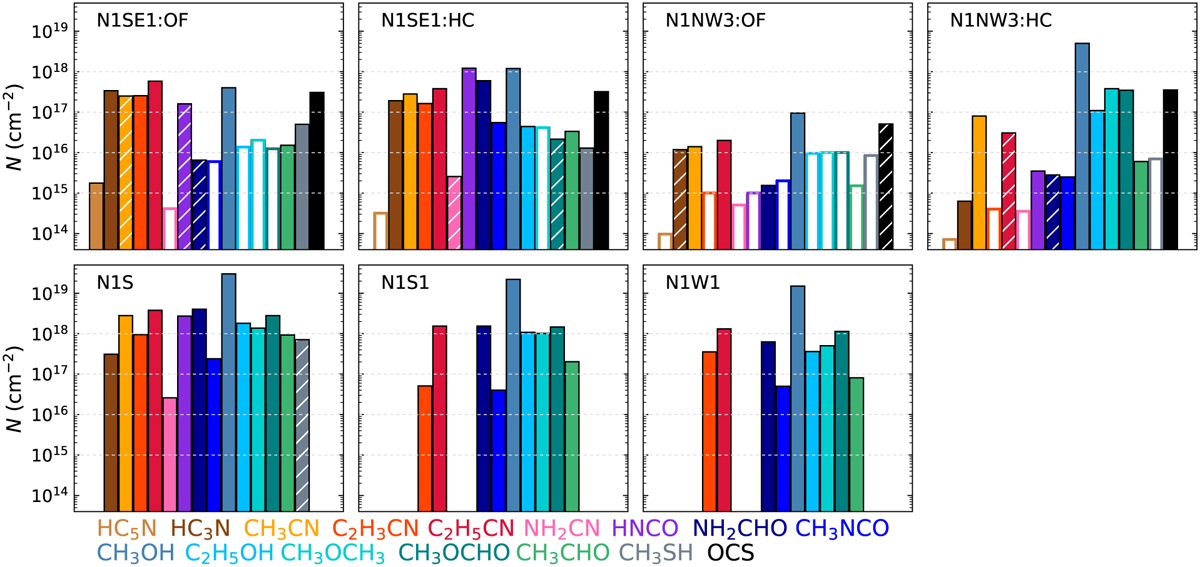
Column densities of various organic molecules for the outflow (OF) and hot-core (HC) components at positions NISEI and N1NW3, as well as at N1S, N1S1, and N1W1. Empty bars indicate upper limits. In all panels hatched bars indicate when the rotational temperature in a population diagram (PD) was fixed (NH2CN at N1SE1:HC and CH3SH at N1S), the molecule was detected but a PD could not be derived (NH2CHO at N1SE1 :OF), or only an upper limit for the rotational temperature in the PD was derived.
Current usage metrics show cumulative count of Article Views (full-text article views including HTML views, PDF and ePub downloads, according to the available data) and Abstracts Views on Vision4Press platform.
Data correspond to usage on the plateform after 2015. The current usage metrics is available 48-96 hours after online publication and is updated daily on week days.
Initial download of the metrics may take a while.