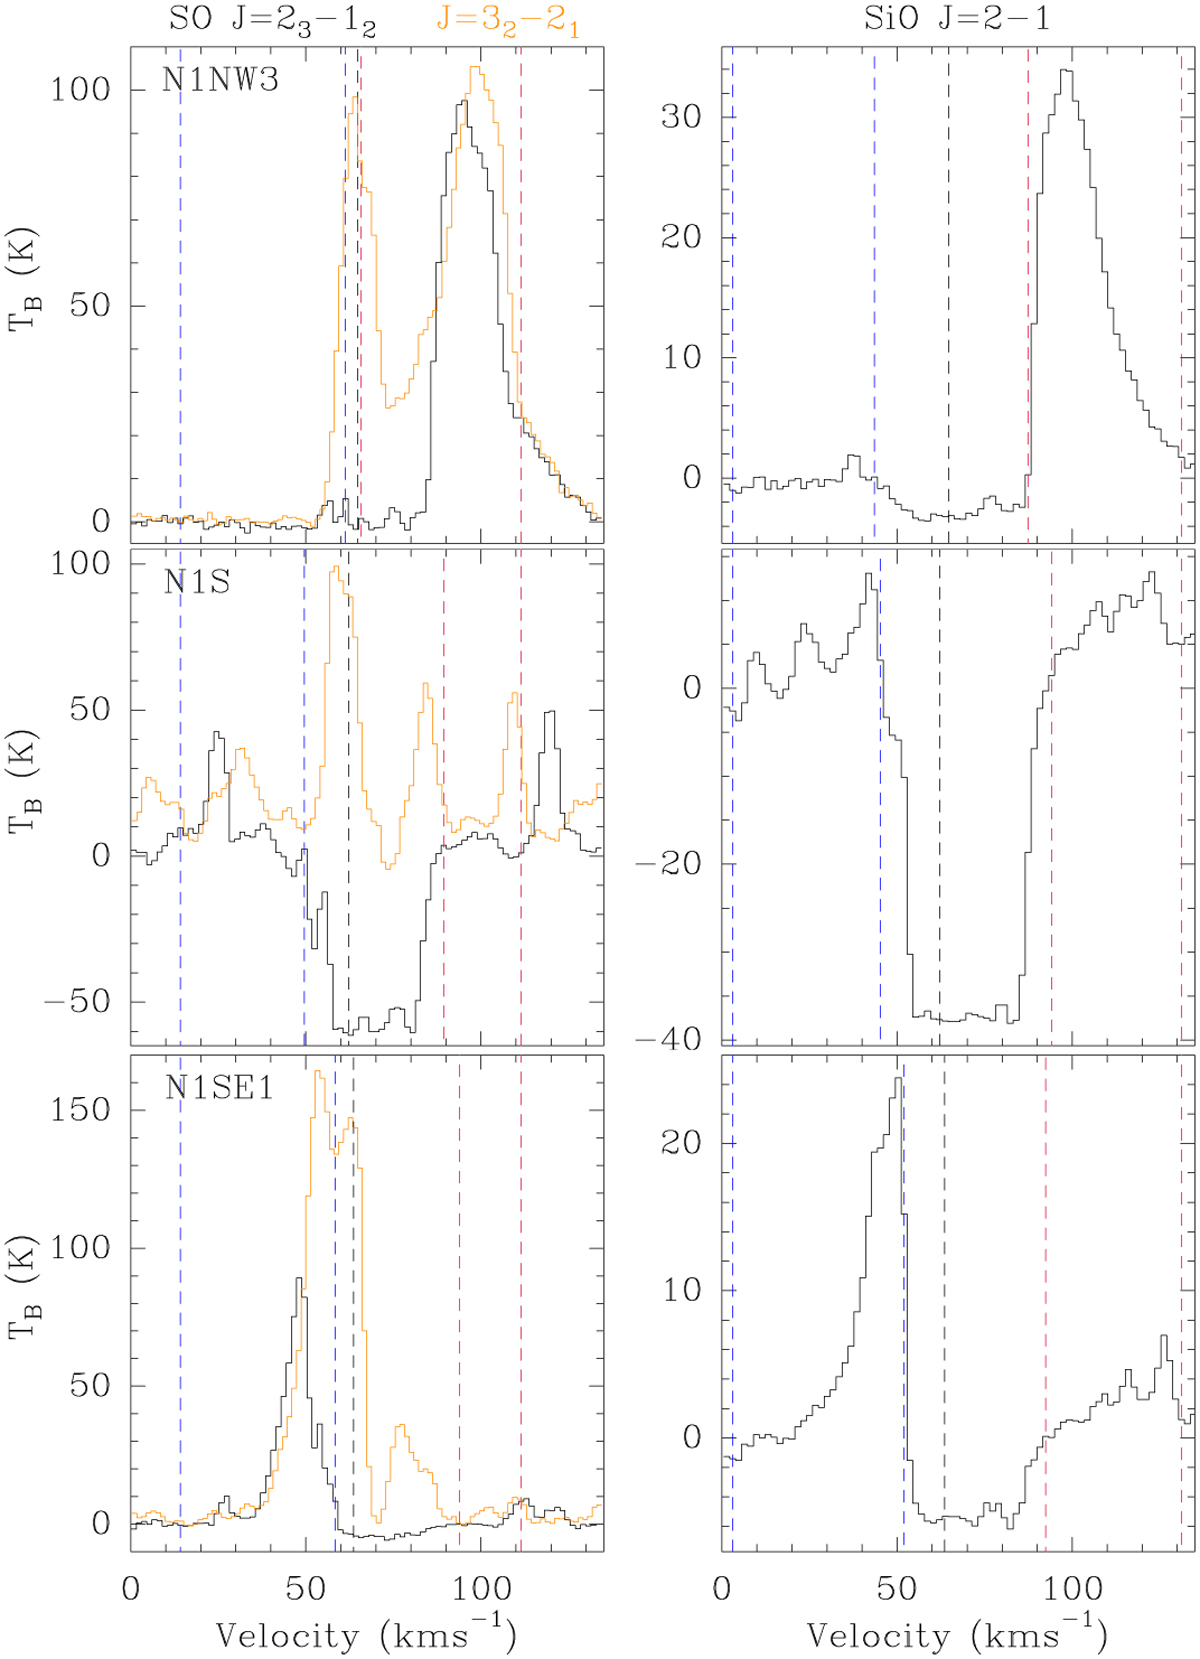
Fig. 3
Download original image
Spectra of SO J = 23 − 12 at 99.3 GHz, SO J = 32 − 21 at 109.25 GHz, and SiO J = 2 − 1 at 86.85 GHz towards a position in the red-shifted lobe (N1NW3, top row), N1S (middle row), and a position in the blue-shifted lobe (N1SE1, bottom row). The black dashed lines mark the systemic velocities of 64.8 km s−1 (N1NW3), 62.2 km s−1 (N1S), and 63.6 km s−1 (N1SE1), while the dashed blue and red lines indicate the inner and outer limits used to integrate the blue- and red-shifted emission shown in Fig. 2. While the outer limits are fixed values, the inner limits are pixel-dependent and set such that channels that contain absorption features close to the systemic velocity are excluded.
Current usage metrics show cumulative count of Article Views (full-text article views including HTML views, PDF and ePub downloads, according to the available data) and Abstracts Views on Vision4Press platform.
Data correspond to usage on the plateform after 2015. The current usage metrics is available 48-96 hours after online publication and is updated daily on week days.
Initial download of the metrics may take a while.