Fig. D.2
Download original image
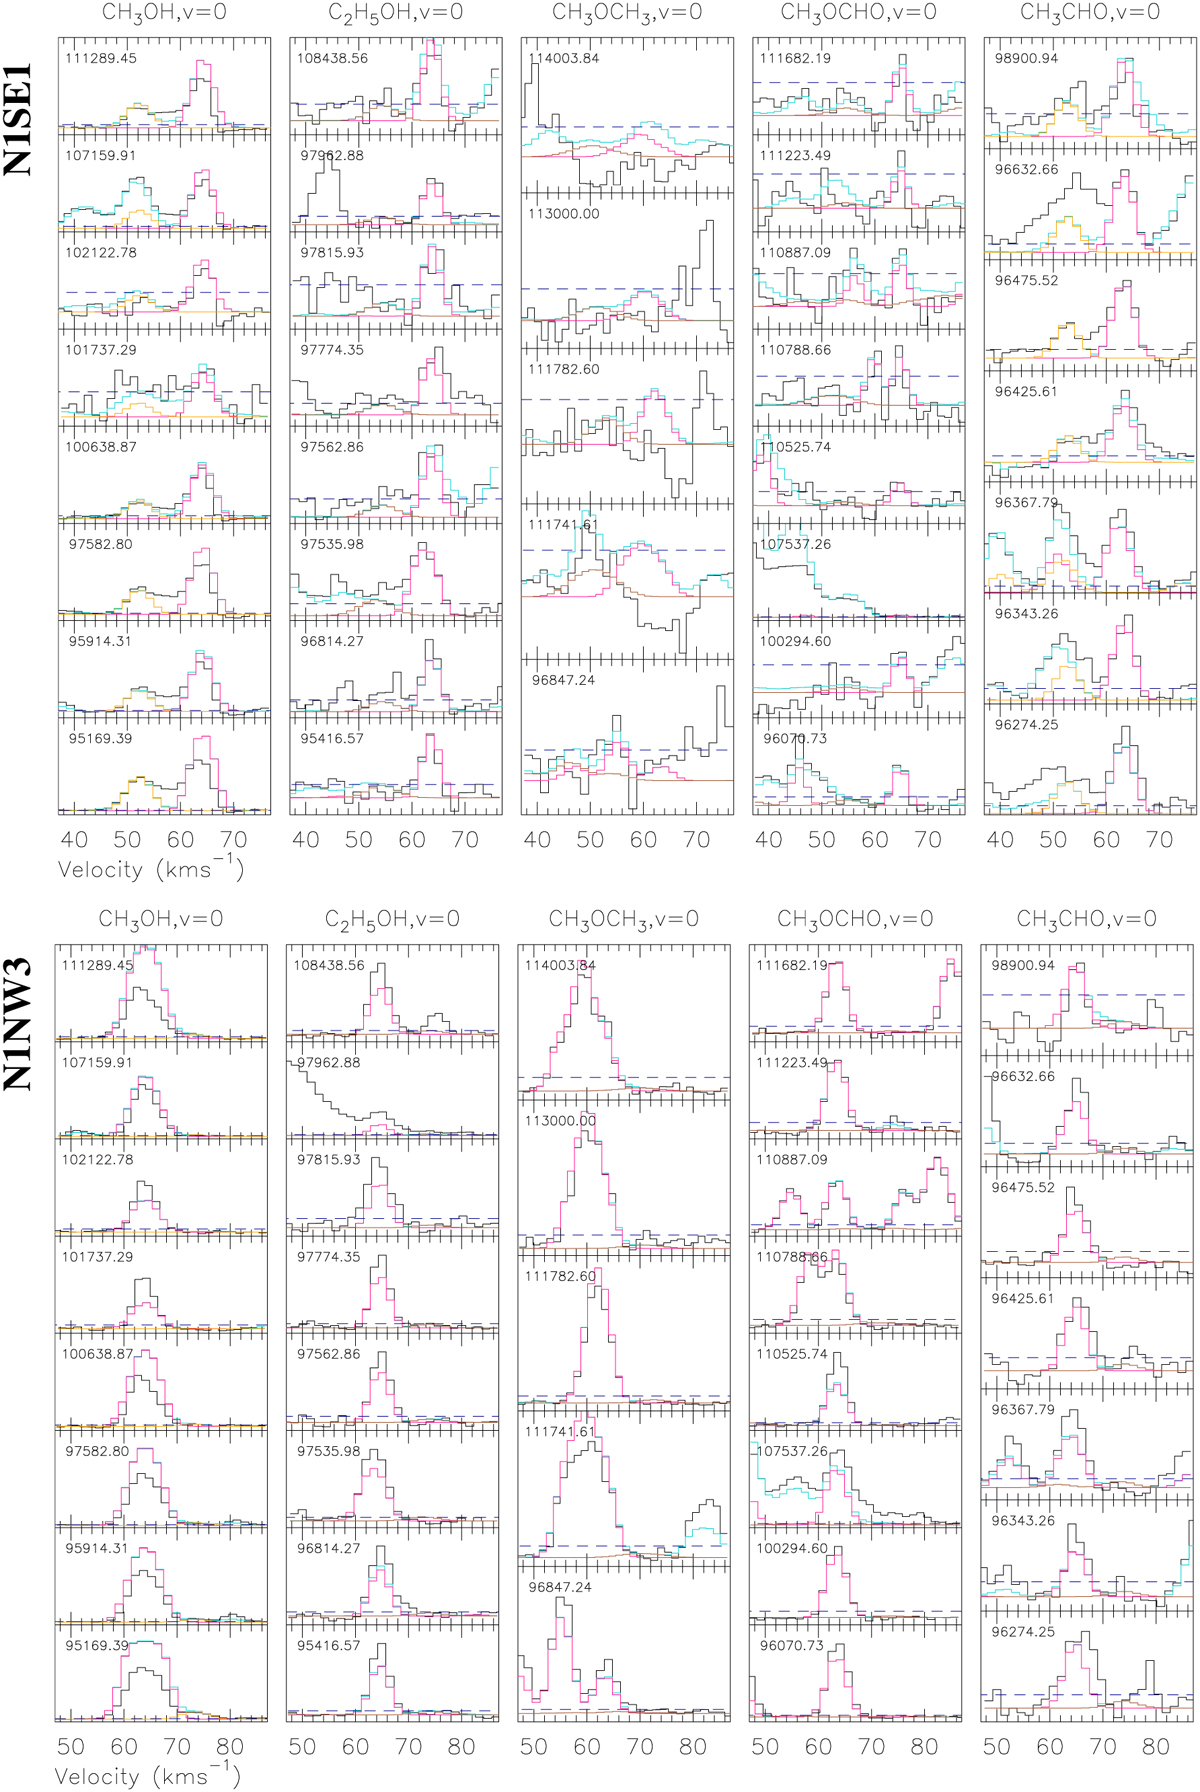
Observed spectra of O-bearing COMs (black) towards N1SE1 (top) and N1NW3 (bottom). The modelled spectra of the hot-core component are shown in pink (if detected) or purple (if not), those of the outflow component in orange (if detected) or brown (if not). The complete Weeds model is drawn in turquoise. The dashed line indicates the 3σ threshold for detection, where σ is taken from Table 2 in Belloche et al. (2019). The frequency in GHz at the reference velocity of 62 km s−1 is shown in each panel.
Current usage metrics show cumulative count of Article Views (full-text article views including HTML views, PDF and ePub downloads, according to the available data) and Abstracts Views on Vision4Press platform.
Data correspond to usage on the plateform after 2015. The current usage metrics is available 48-96 hours after online publication and is updated daily on week days.
Initial download of the metrics may take a while.