Fig. C.1
Download original image
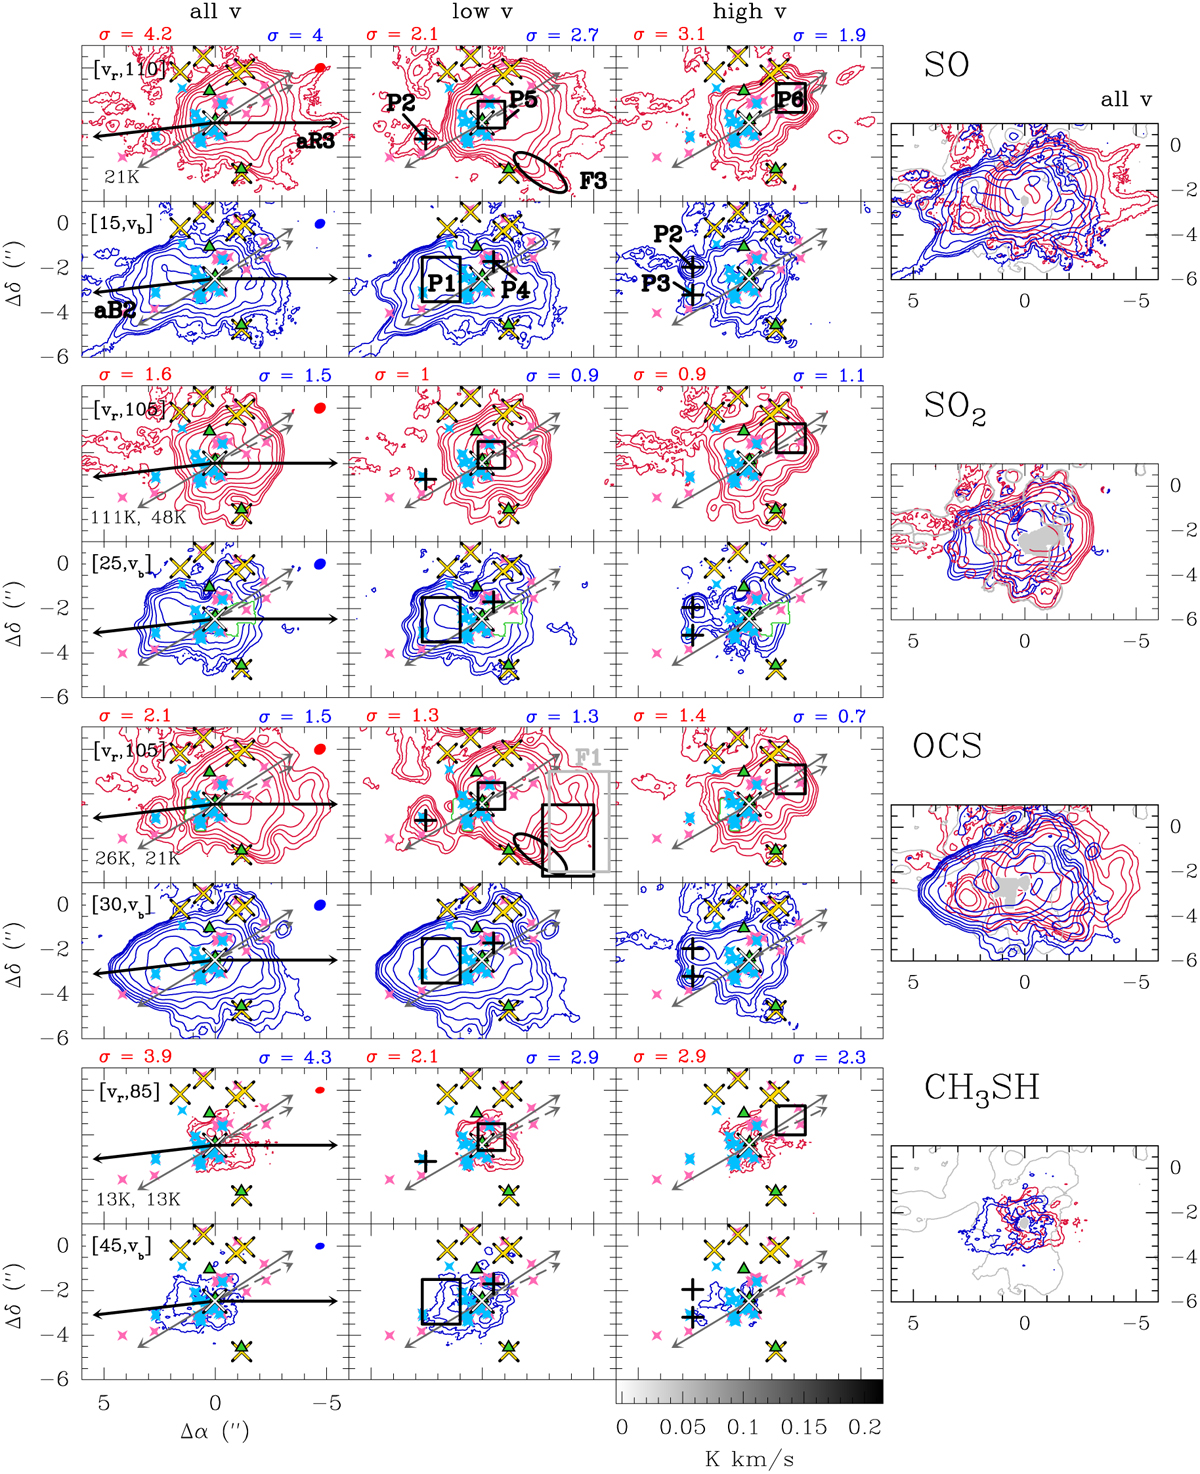
LVINE maps of blue- and red-shifted emission of S-bearing molecules (blue and red contours, respectively). The left-most panels show maps in which intensities were integrated over the complete velocity interval (all v), where the fixed, pixel-independent outer integration limits (in km s−1) are shown in the top left corner. The maps in the second column (low v) show intensities integrated over half the total velocity interval with velocities closer to vsys, while in the maps in the third column (high v), intensities were integrated over the other half up or down to the outer integration limits. In the right-most panels, the all-v maps of blue- and red-shifted emission are overlaid as in Fig. 4. The contour steps start at 5σ and then increase by a factor of 2, where σ is the average noise level measured in an emission-free region in each map and is given at the top of each panel in K km s−1. The grey contour indicates the 3σ level of the continuum emission at 99 GHz. The closest region around Sgr B2 (N1) is masked due to high continuum optical depth that depends on frequency and beam size (see Appendix C in Paper I). For OCS and SO2, the masked region was extended due to contamination by emission of other species. Masks are either shown in white within a green contour or as grey-shaded regions. Grey arrows indicate the directions of the collimated features labelled aB1, aR1, and aR2 in Fig. 2. Coloured markers are the same as in Fig. 2. Identified intensity peaks P1−P6 and elongated features F1−F3, as well as additional bipolar-like extensions labelled aR3 and aB2 are drawn in black. The upper-level energies of the transitions used to produce the maps are shown in the bottom left corner of the top left panels, respectively. Other properties of the transitions are summarised in Table C.1. The respective HPBW is shown in the top right corner of the left-most panels. The position offsets are given with respect to the ReMoCA phase centre.
Current usage metrics show cumulative count of Article Views (full-text article views including HTML views, PDF and ePub downloads, according to the available data) and Abstracts Views on Vision4Press platform.
Data correspond to usage on the plateform after 2015. The current usage metrics is available 48-96 hours after online publication and is updated daily on week days.
Initial download of the metrics may take a while.