Fig. 2
Download original image
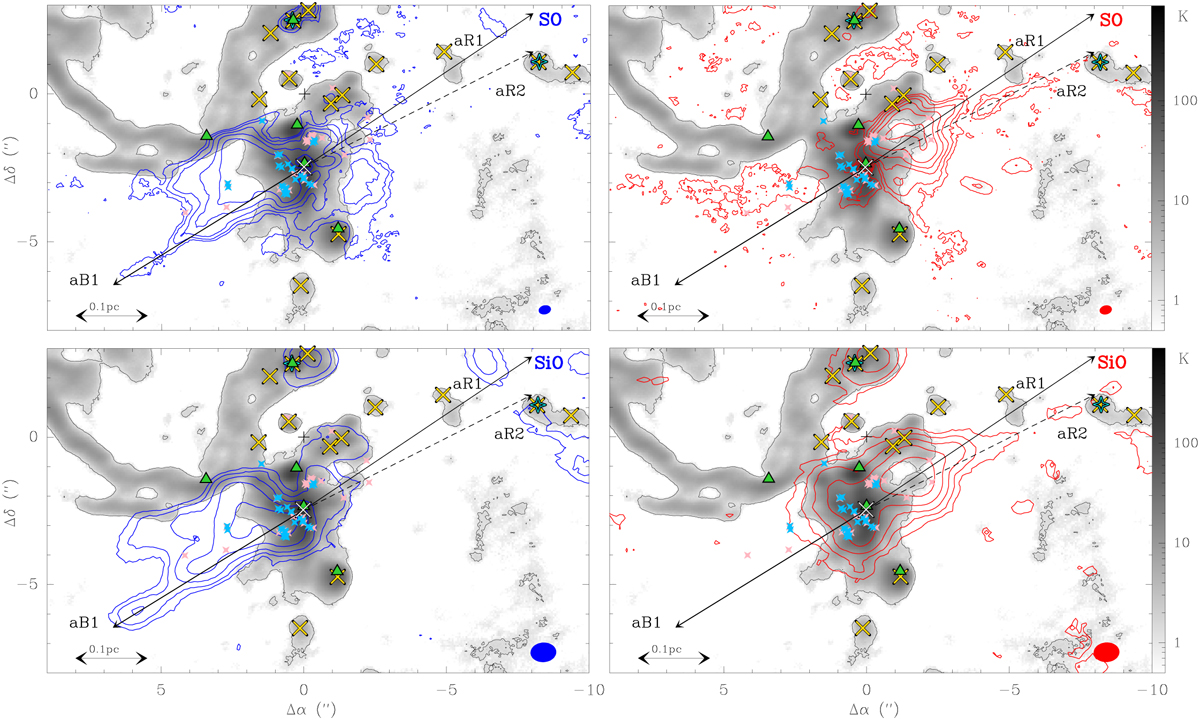
Continuum emission at 99 GHz in grey scale overlaid by contours of SO J = 23−12 at 99.3 GHz (top) and SiO J = 2−1 at 86.85 GHz (bottom) integrated intensities. The inner integration limits vary such that channels that contain deep absorption are excluded. The outer integration limits are fixed at 15 and 115 km s−1 for blue- and red-shifted SO emission, respectively, and 5 and 130 km s−1 for blue- and red-shifted SiO emission, respectively (see also Fig. 3). The blue and red contours start at 5σ and then increase by a factor of 2, where σ = 10.5 (SO, blue), 10.8 (SO, red), 4.5 (SiO, blue), and 5.8 K km s−1 (SiO, red) and corresponds to an average noise level that was measured in the respective map. The black contour indicates the 3σ level of the continuum emission (see Fig. 1). Based on the SO maps, we identify collimated features possibly tracing outflow axes that are shown as solid and dashed black arrows and are labelled aB1, aR1, and aR2. The markers are the same as in Fig. 1. In addition to N2, the hot core N3 identified by Bonfand et al. (2017) is marked with a cyan tetragon. Blue and pink star markers indicate H2O maser spots (McGrath et al. 2004) with blue- and red-shifted velocities, respectively, with respect to υsys = 62 km s−1. The HPBW is shown in the bottom right corner of each panel. The position offsets are given with respect to the ReMoCA phase centre (black cross). The maps are not corrected for primary-beam attenuation.
Current usage metrics show cumulative count of Article Views (full-text article views including HTML views, PDF and ePub downloads, according to the available data) and Abstracts Views on Vision4Press platform.
Data correspond to usage on the plateform after 2015. The current usage metrics is available 48-96 hours after online publication and is updated daily on week days.
Initial download of the metrics may take a while.