Fig. 10
Download original image
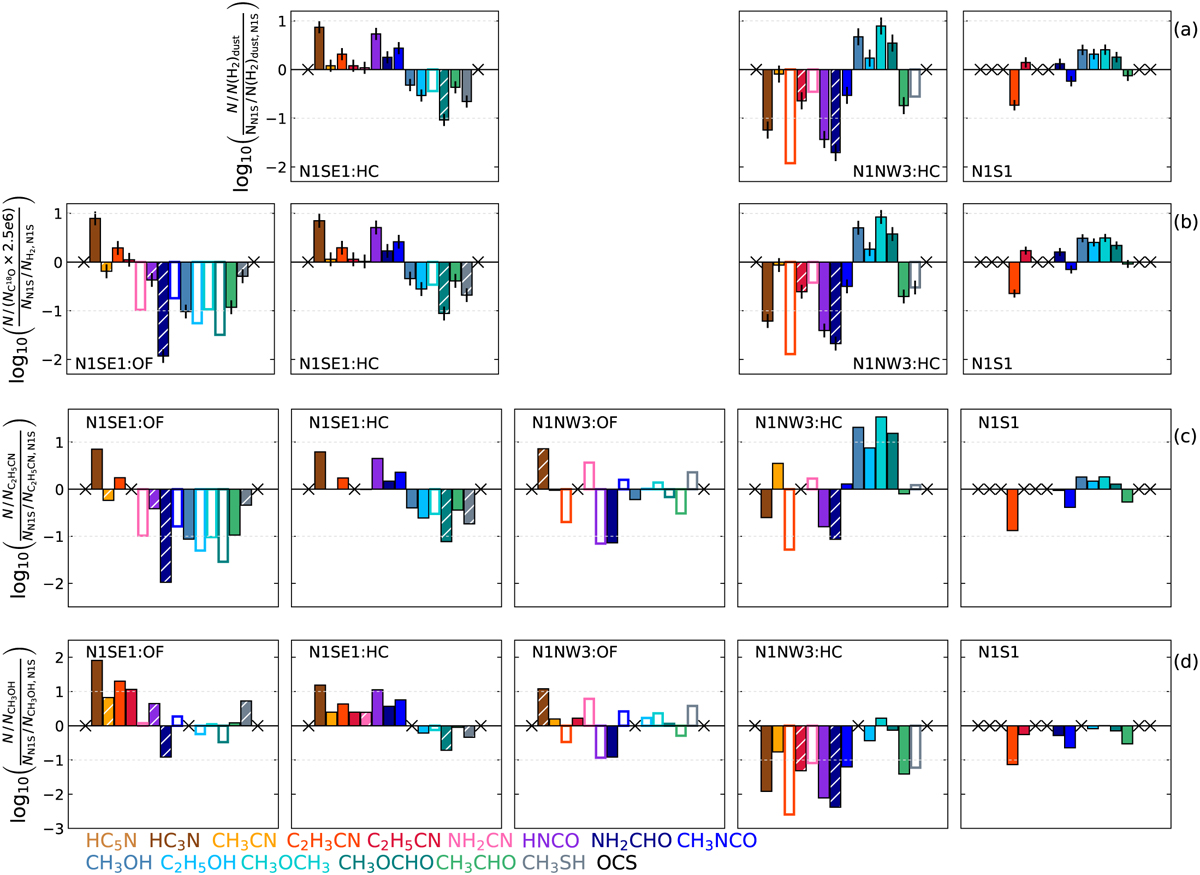
Comparison of the gas molecular content in the hot-core and outflow components at N1SE1 and N1NW3 amongst each other and with positions N1S and N1S1, which were analysed in Paper I. Rows a–b: abundances with respect to H2 normalised to the value derived at N1S, where H2 column densities were derived from a) dust emission at 242 GHz and b) C18O for all components but N1S, for which the value from dust emission was used in both rows. Component N1NW3:OF is not shown, because C18O is difficult to identify due to contamination by another molecule. Rows c–d: same as (b), but abundances with respect to C2H5CN and CH3OH are shown, respectively. In all panels, hatched bars indicate when the rotational temperature in a population diagram (PD) was fixed (NH2CN at N1SE1:HC and CH3SH at N1S), the molecule was detected but a PD could not be derived (NH2CHO at N1SE1:OF), or only an upper limit for the rotational temperature in the PD was derived. Empty bars show upper limits. HC5N and OCS are not shown as we do not have the column densities of the two molecules at N1S.
Current usage metrics show cumulative count of Article Views (full-text article views including HTML views, PDF and ePub downloads, according to the available data) and Abstracts Views on Vision4Press platform.
Data correspond to usage on the plateform after 2015. The current usage metrics is available 48-96 hours after online publication and is updated daily on week days.
Initial download of the metrics may take a while.