Fig. 1
Download original image
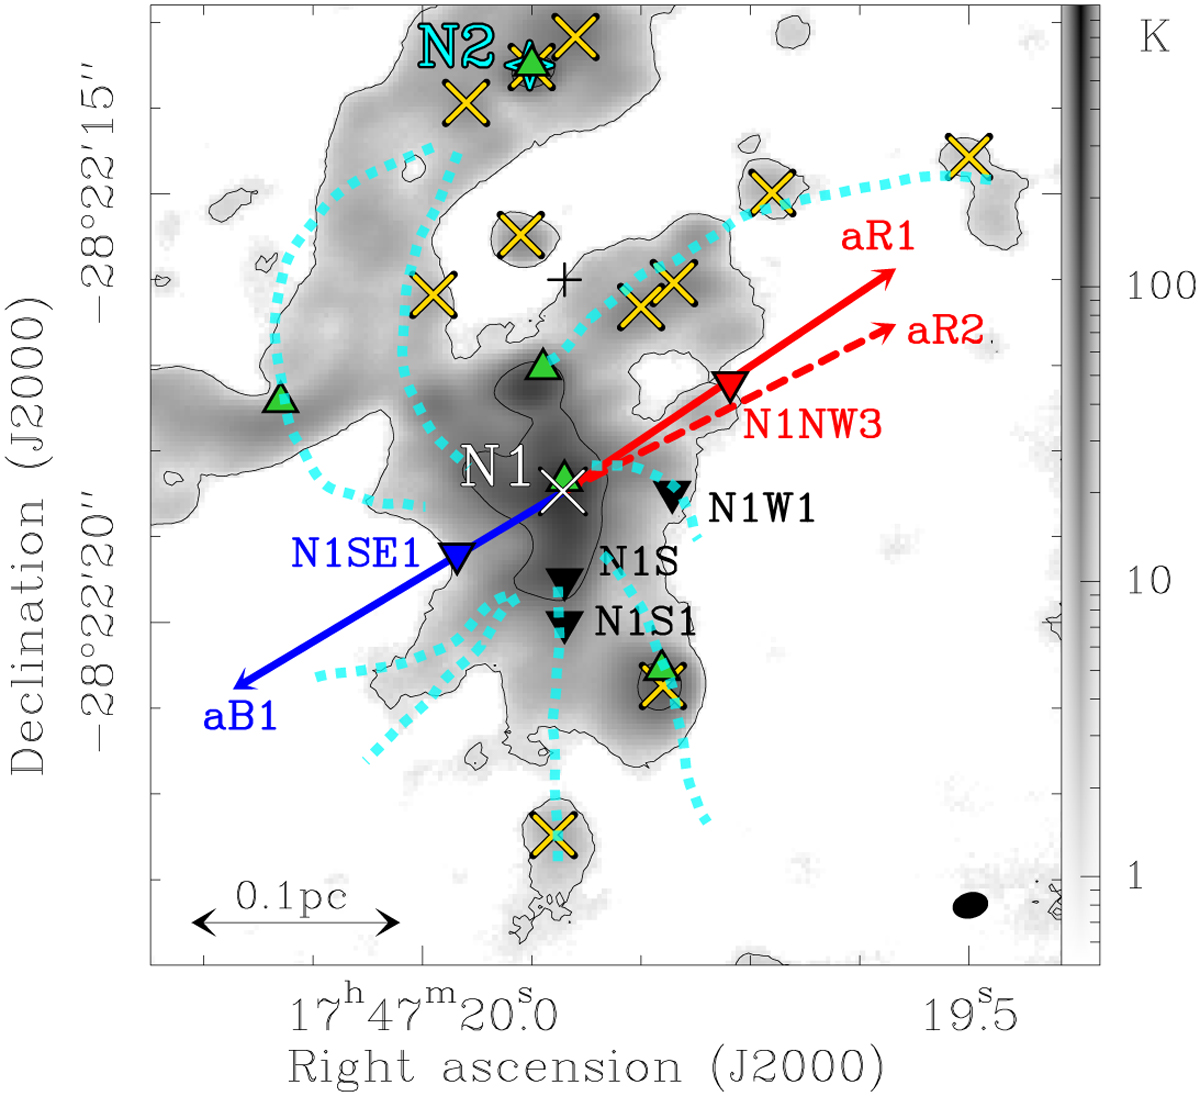
Continuum map at 99 GHz extracted from the ReMoCA survey data of the central region of Sgr B2 (N) in grey scale with contour steps 3σ and 81σ, where σ = 0.4 K. The centre of the main hot core N1 is marked in white and was determined based on the ReMoCA data in Busch et al. (2022). The position of the secondary hot core N2 is shown with a cyan tetragon and was determined by Bonfand et al. (2017) on the basis of the EMoCA survey. Emission peaks of HII regions (Gaume et al. 1995; De Pree et al. 2015) are marked with green triangles and continuum sources identified by Sánchez-Monge et al. (2017) based on their 1 mm ALMA data are shown with yellow crosses. Filaments identified by Schwörer et al. (2019) based on the same 1 mm (continuum and spectral-line) data are roughly indicated in cyan. The blue and red arrows labelled aB1, aR1, and aR2 indicate the outflow axes identified in this work based on SO emission (see Sect. 3.1.1). Positions N1SE1 and N1NW3 are analysed in this work. They are located along axes aB1 and aR1 at (1.3″,–3.2″) and (−2.0″,–1.2″), respectively, where the coordinates are given in equatorial offsets from the ReMoCA phase centre (black cross). Positions N1S, N1S1, and N1W1, which are not associated with the outflow, were studied in Busch et al. (2022), but they are revisited in this work. The HPBW is shown in the bottom right corner. The map is not corrected for primary-beam attenuation.
Current usage metrics show cumulative count of Article Views (full-text article views including HTML views, PDF and ePub downloads, according to the available data) and Abstracts Views on Vision4Press platform.
Data correspond to usage on the plateform after 2015. The current usage metrics is available 48-96 hours after online publication and is updated daily on week days.
Initial download of the metrics may take a while.