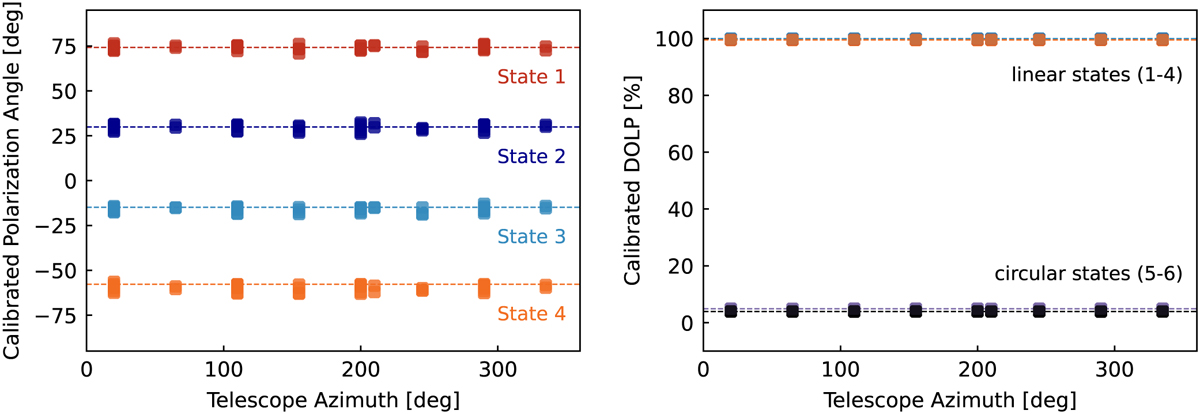
Fig. 9
Download original image
Test data calibrated with the fitted polarization model. The data are the same as in Figs. 7 and 8 but now calibrated. In both plots, the data are shown as dots, and the input states as dashed lines. The different colors show the different input states. The left plot shows the polarization angle, and the right plot shows the DOLP. Since all states are fully polarized, the recovered degree of circular polarization is (100 - DOLP).
Current usage metrics show cumulative count of Article Views (full-text article views including HTML views, PDF and ePub downloads, according to the available data) and Abstracts Views on Vision4Press platform.
Data correspond to usage on the plateform after 2015. The current usage metrics is available 48-96 hours after online publication and is updated daily on week days.
Initial download of the metrics may take a while.