Fig. 8
Download original image
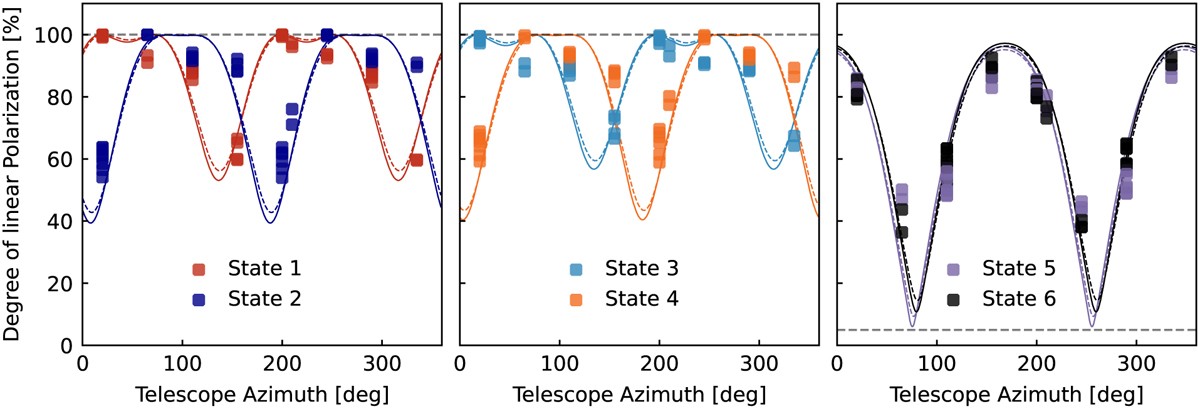
Measured DOLP for the different input states. Left and middle: linear input states, where the input DOLP is 100%. Right: circular states, where the input is fully circularly polarized, so 0% linear polarization. The data points are shown in different colors for the different states. The data from 50 and 70° elevations are shown together. The lines in the same color show the model prediction for each state (solid line for 70° elevation and dotted for 50° elevation). The dashed gray line shows the input values in all plots.
Current usage metrics show cumulative count of Article Views (full-text article views including HTML views, PDF and ePub downloads, according to the available data) and Abstracts Views on Vision4Press platform.
Data correspond to usage on the plateform after 2015. The current usage metrics is available 48-96 hours after online publication and is updated daily on week days.
Initial download of the metrics may take a while.