Fig. 7
Download original image
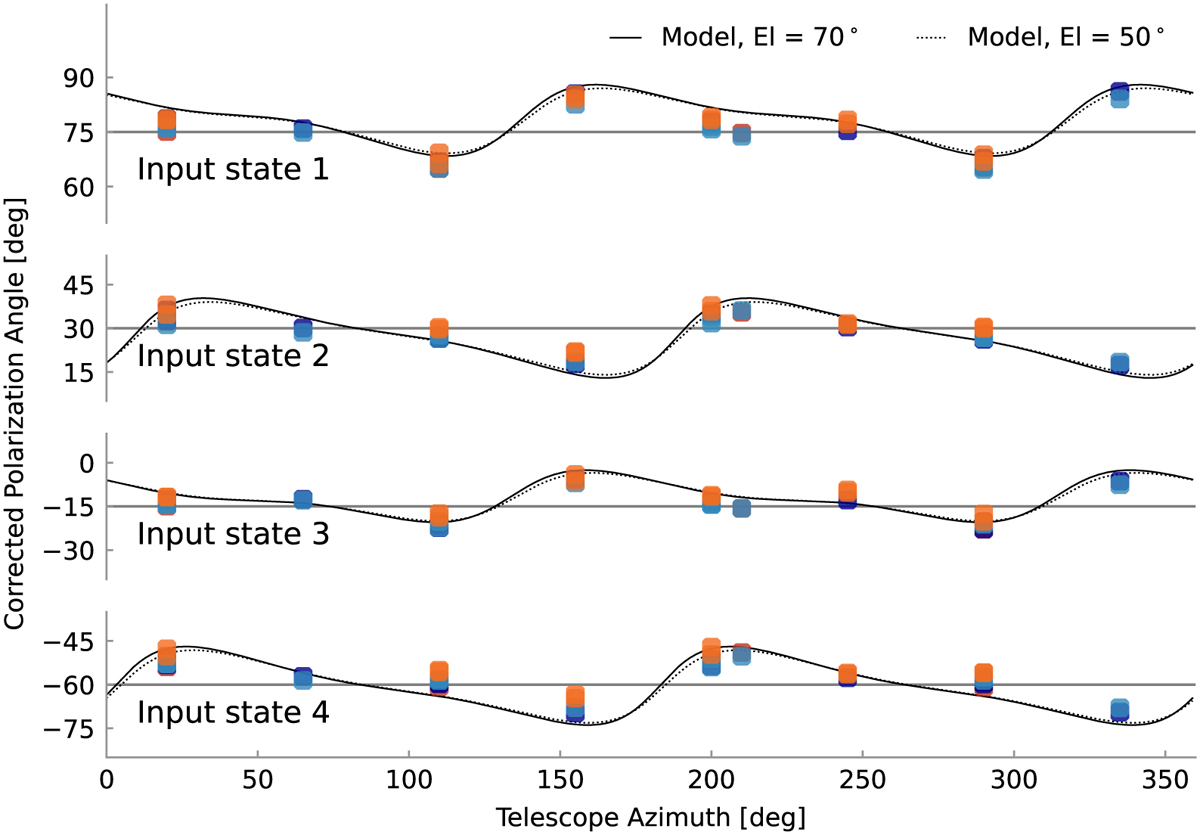
Measured polarization angles for the different telescope positions, only corrected by the geometric rotation of the field. The four panels show the data for each linear input state, with the different colors showing the data from the four UTs. The data from 50 and 70° elevations are shown together. The gray horizontal line shows the input values for the polarization angles, the solid black line the value expected from the model for 70° elevation, and the dotted black line the model for 50° elevation.
Current usage metrics show cumulative count of Article Views (full-text article views including HTML views, PDF and ePub downloads, according to the available data) and Abstracts Views on Vision4Press platform.
Data correspond to usage on the plateform after 2015. The current usage metrics is available 48-96 hours after online publication and is updated daily on week days.
Initial download of the metrics may take a while.