Fig. 16
Download original image
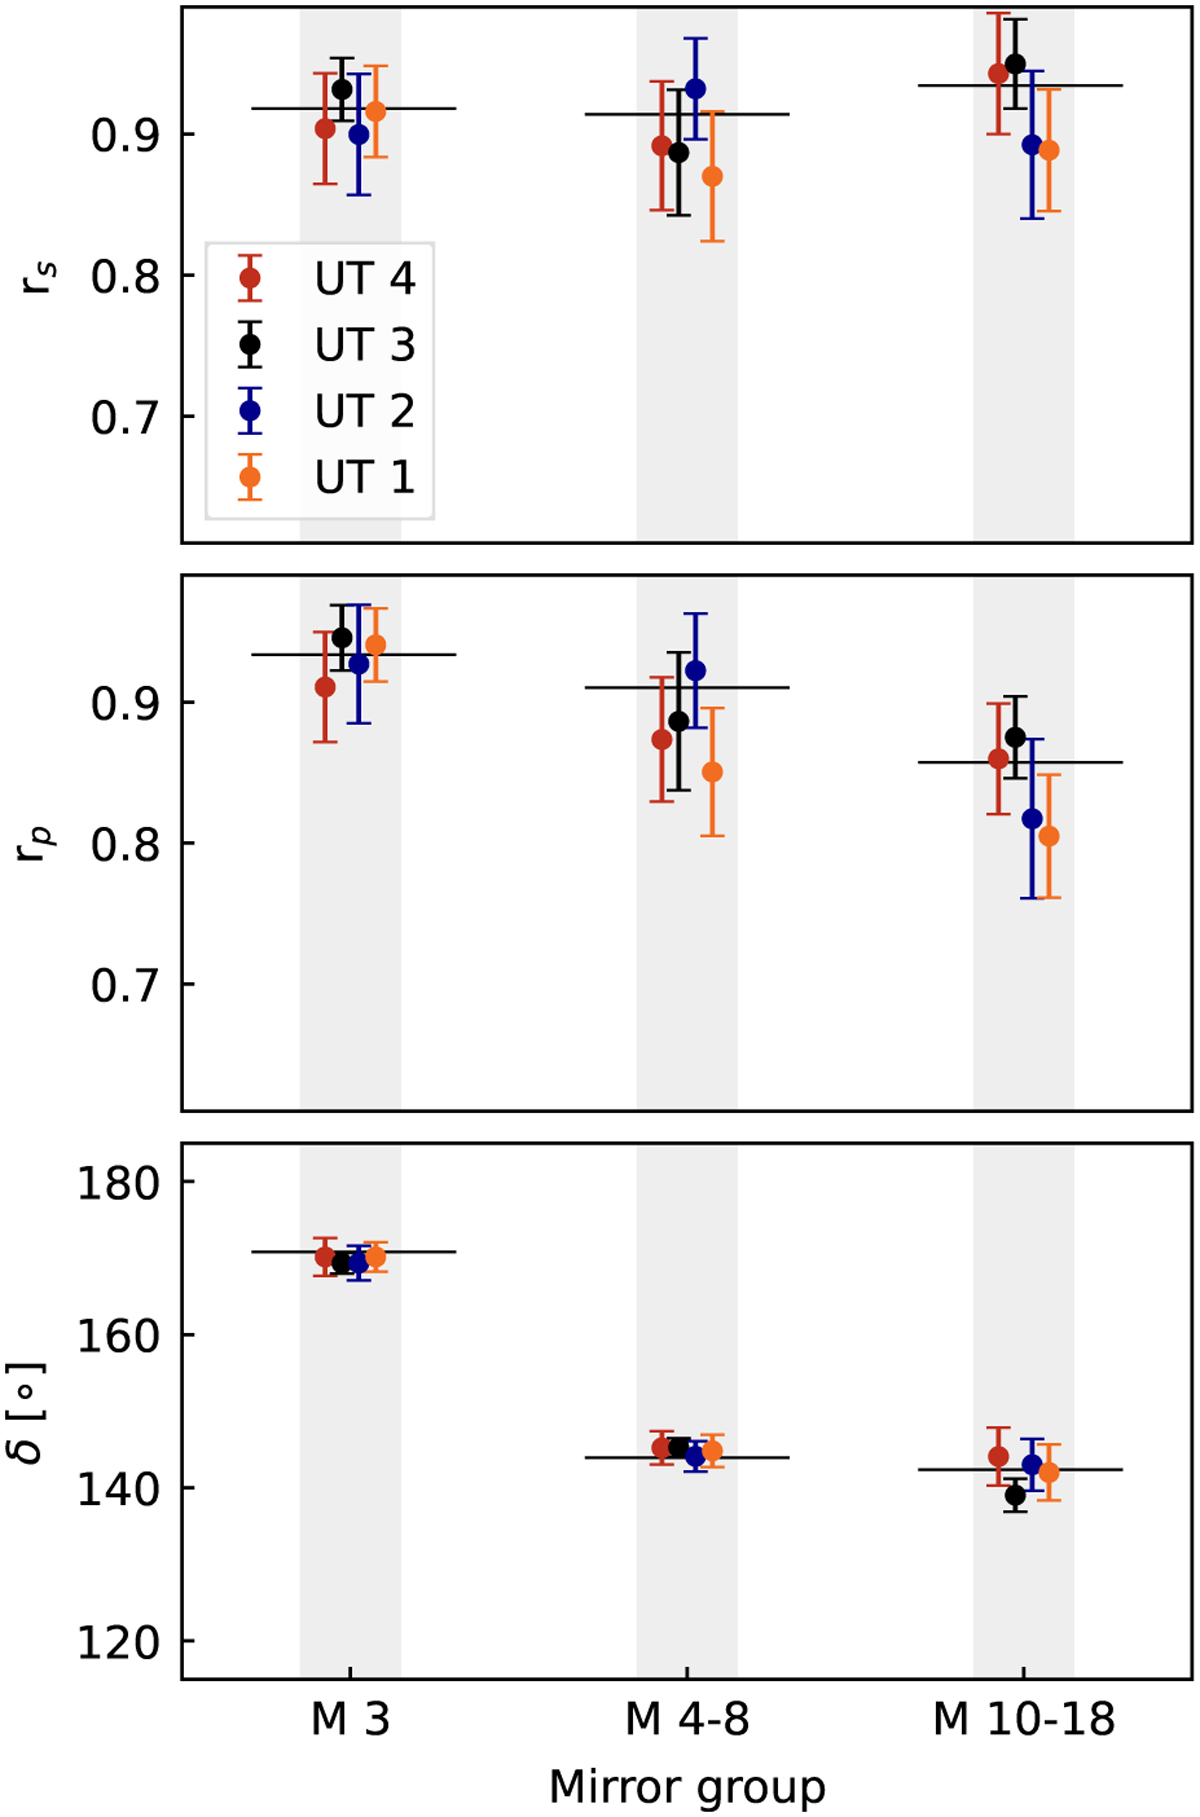
Comparison of the fitting values for the individual telescopes. The three plots show the reflectivity in the s and p directions, as well as the phase difference for each group of mirrors. The data points of all telescopes are grouped for one mirror group, and the fitting value for the combined fit is shown as a black horizontal line. rs , rp and δ are defined in Eq. (43).
Current usage metrics show cumulative count of Article Views (full-text article views including HTML views, PDF and ePub downloads, according to the available data) and Abstracts Views on Vision4Press platform.
Data correspond to usage on the plateform after 2015. The current usage metrics is available 48-96 hours after online publication and is updated daily on week days.
Initial download of the metrics may take a while.