Open Access
Fig. 15
Download original image
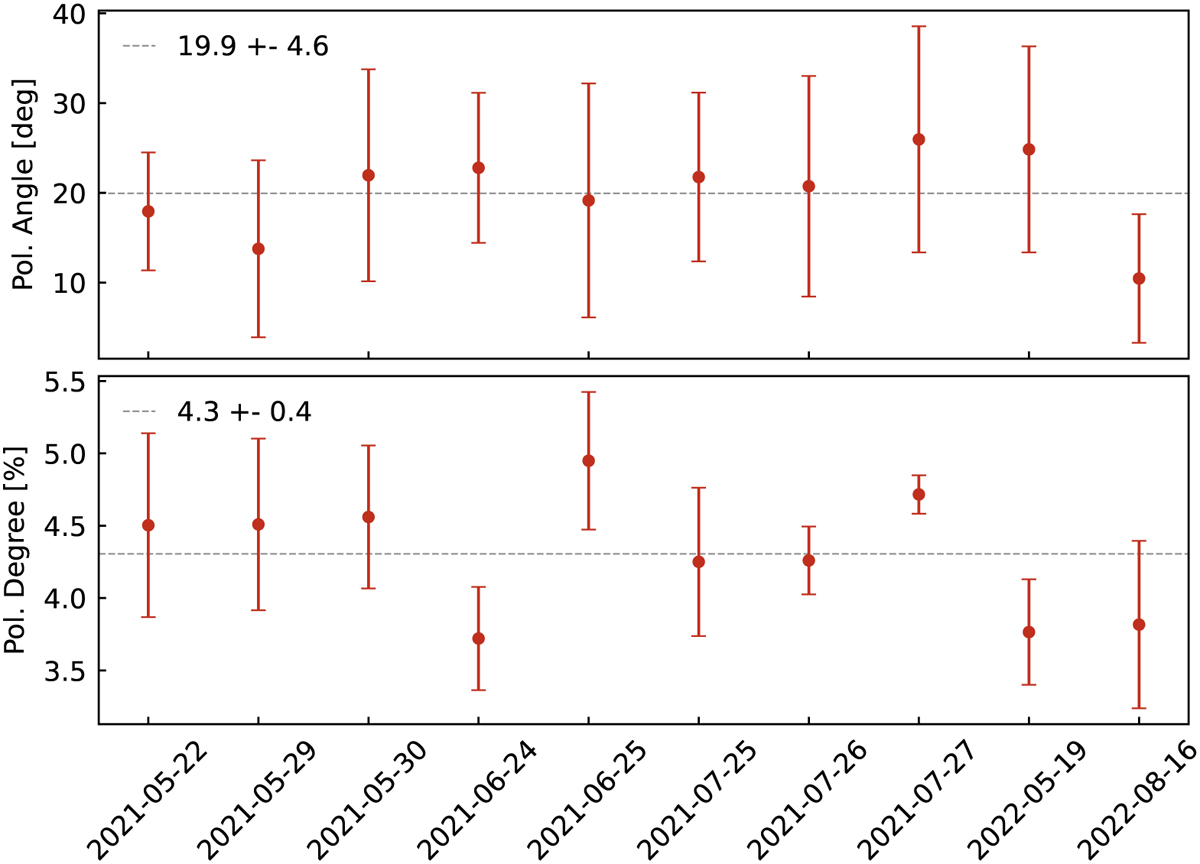
Polarization measurements of IRS 16C between 2019 and 2022. The top panel shows the polarization angle for each night, and the bottom panel shows the polarization degree. The average over all nights is shown as a horizontal line
Current usage metrics show cumulative count of Article Views (full-text article views including HTML views, PDF and ePub downloads, according to the available data) and Abstracts Views on Vision4Press platform.
Data correspond to usage on the plateform after 2015. The current usage metrics is available 48-96 hours after online publication and is updated daily on week days.
Initial download of the metrics may take a while.