Open Access
Fig. 1
Download original image
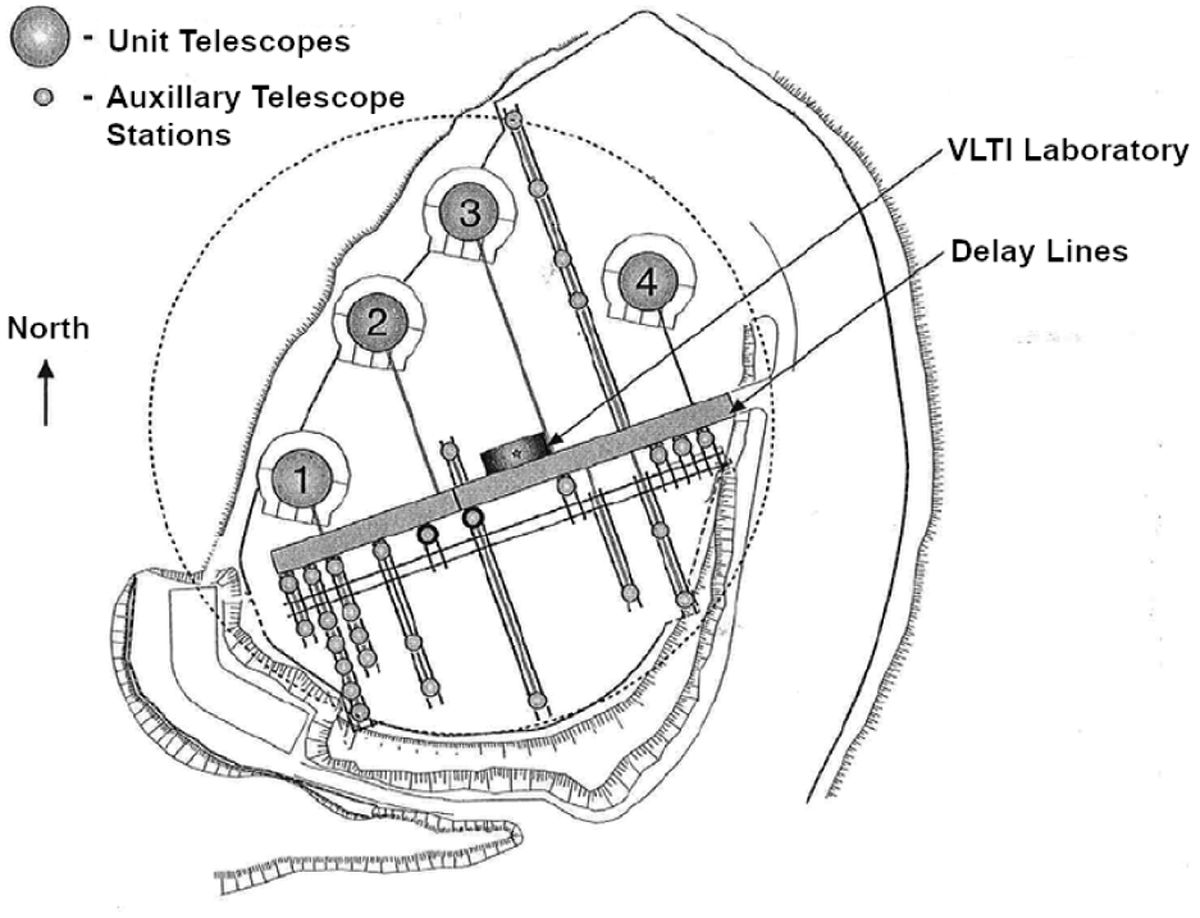
Schematic layout of the VLTI platform. The positions of the four UTs are shown as big circles, and the possible stations for ATs as small circles. The delay lines and the VLTI Lab are indicated in the center of the platform.
Current usage metrics show cumulative count of Article Views (full-text article views including HTML views, PDF and ePub downloads, according to the available data) and Abstracts Views on Vision4Press platform.
Data correspond to usage on the plateform after 2015. The current usage metrics is available 48-96 hours after online publication and is updated daily on week days.
Initial download of the metrics may take a while.